Child Poverty
Last Modified 28/03/2023 14:38:09
Share this page
Introduction
Despite being one of the wealthiest countries in the world, almost a fifth of children in the UK live in households where income is less than 60% of median household income before housing costs (a measure of relative poverty).1 In 2010, the Marmot review2 highlighted that children who grow up in poverty are much more likely to suffer poorer health, lower education achievement and a lower economic status than children born into wealthier families.
Ten years after the original review the Institute of Health Equity's 'Health Equity in England: The Marmot Review 10 Years On'3 reported that since 2010 rates of child poverty in the UK have increased and are now back to pre-2010 levels, with over four million children estimated to be growing up in poverty after taking into account housing costs. Based on 2017/18 figures, 22% of children were living in poverty before housing costs in England, increasing to 30% after housing costs. Pre COVID-19 projections suggested that this may rise to 37% by 2023/24, equivalent to 5.2 million children4, with more recent projections suggesting increases in both absolute and relative child poverty by 2026/275.
Both reports emphasised that early intervention is likely to have more success (and be more cost-effective in the longer term) than interventions applied later in life to address the resultant problems.
Following the original Marmot review, the government introduced The Child Poverty Act 20106 which set income-based UK-wide targets to be met by 2020. The legislation and associated guidance required councils to develop Child Poverty Strategies with the aim of reducing and mitigating the effects of child poverty. In 2016 the Welfare Reform and Work Act superseded the Child Poverty Act and repealed these targets, removing many of the statutory responsibilities of local authorities to directly assess need and report on the prevalence of child poverty in their areas7.
In 2021 the Children's Commissioner for England called for a renewed focus on tackling child poverty, particularly in light of the impact of COVID-19 on employment and family incomes, and the UK Government's desire to 'build back better'. During the COVID-19 period poverty has, at least for some, translated into food insecurity and hunger, with households with children more likely to experience food insecurity during the first lockdown. At the end of April 2020, 249,000 children were in families that had accessed foodbanks8.
The impacts of child poverty
The impacts of child poverty are seen in all areas of the child's life including their education, health and future chances.
Poverty negatively impacts on children's educational experience, attainment and prospects
-
- In 2018/19 the proportion of children achieving a good level of development at age 5 was 57% for children eligible for free school meals (FSM), compared to 74% for all other children
- The proportion of children meeting expected standard for reading, writing and maths aged 10-11 was 47% for children eligible for FSMs, compared to 68% for all other children
- The proportion of children meeting expected grades between 9 (highest) and 4 on English and Maths at GCSE age 15-16 was 41% for those eligible for FSMs, compared to 69% for all other children.
- In 2018, those on free school meals were over twice as likely as non-FSM students to leave school at age 19 without Level 2 qualifications (37% compared to 15%)
- For pupils eligible for FSM at 16, median annual earnings were £13,500 by age 28, compared to the UK national median of £30,5008
- Children who have lived in persistent poverty during their first seven years have, on average, cognitive development scores 20 per cent below those of children who have never experienced poverty.9
A 2021 survey of 2,500 National Education Union members also found that 55% of respondents had observed an increase in child poverty in their school since the start of the first COVID-19 restrictions in March 2020, with over half of members saying that their students had experienced hunger (57%), and ill-health (50%) as a result of poverty10.
Poverty is also associated with a higher risk of both illness and premature death.
-
- Children born in the poorest areas of the UK weigh, on average, 200 grams less at birth than those born in the richest areas.
- Children from low income families are more likely to die at birth or in infancy than children born into wealthier families9.
- Children living in poor quality accommodation are more like to contract menigitis, experience resipratory difficulties and suffer from mental ill-health.
- Prevalence of emotional disorders such as depression and anxiety is almost twice as high for children living in receipt of income-related benefits, and three times as high in families receiving disability benefits11.
- In the most deprived areas people will die nine years younger and can expect to live on average 19 to 20 fewer years in 'good health' compared to those in the least deprived12.
Poverty impacts the way children are able to interact with their environments
-
- Children living in poverty are more likely to live in poor quality and insecure accommodation, as well as in areas of higher crime and poor overall environment. Unaffordable housing costs can also exacerbate poverty levels within families.
- Fuel poverty also affects children detrimentally as they grow up as low income families do sometimes have to make a choice between food and heating.
- Children from low income families often forgo events that most of us would take for granted, for example school trips, inviting friends round for tea and holidays8,11.
The economic impact of COVID-19, compounded by high fuel and energy prices, is pushing more children into poverty, with increased food insecurity, poor housing and insufficient money for essential bills8,13.
The drivers of child poverty
The UK Government's 2014 report 'An evidence review of the drivers of child poverty for families in poverty now and for poor children growing up to be poor adults' identified 13 key characteristics that make it harder for some families to get out of poverty and that make some poor children more likely to become poor adults:
- (Long-term) Worklessness & Low Earnings
- Parental Qualifications
- Family Instability
- Family Size
- Parental Health
- Educational Attainment
- Housing
- Neighbourhood
- Debt
- Drug and Alcohol Dependency
- Child Health
- Non-Cognitive Development
- Home Learning Environment, Parenting Styles & Aspirations
Child poverty rates are highest for children living in workless families (over 70%), however the proportion of children living in poverty despite one or more parents working has been steadily increasing since 2010, and having parents in work is not a guaranteed route out of poverty3. Part-time workers, low-paid workers and employment sectors such as accommodation and food services are also at greater risk of being drawn into poverty, particularly as a consequence of the economic and health impacts of COVID-195. Children living in lone-parent families, in families with three or more children, and with disability in the family are also at greater risk of growing up in poverty, and some minority ethnic communities also have higher rates of child poverty. This highlights how intersections of poverty, inequality, discrimination and exclusion can impact on the lives of children in the UK3,14.
Facts and figures
There is no single definition or measure of child poverty in the UK, and different indicators show different results depending on what and how they measure, and whether poverty is measured before or after housing costs. There is often a focus on income-based poverty statistics, though it is important to recognise that poverty is broader than family income. It also affects, and is affected by, a range of wider factors as described above.
The 2019 Index of Multiple Deprivation (IMD) Score ranks Blackpool as the most deprived Local Authority in England. This ranking indicates an increase in general deprivation levels compared to other authorities since 2010 when Blackpool was ranked 6th, 2007 when Blackpool was ranked 12th, and 2004 when it was ranked 24th.
Worklessness and low earnings
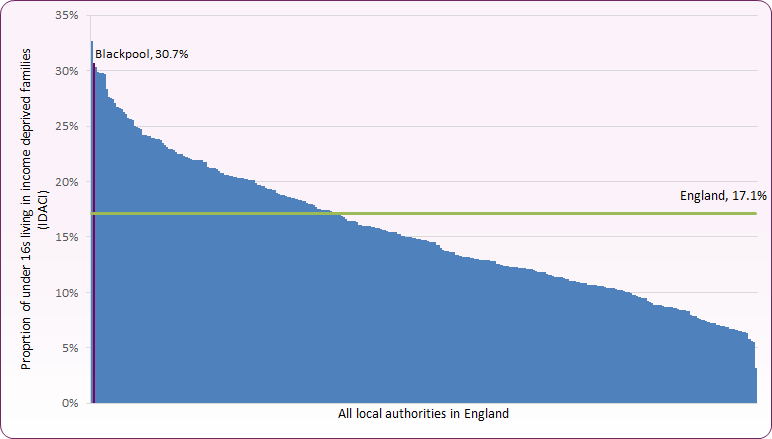
The Income Deprivation Affecting Children Index (IDACI) is an estimation of children aged 0-15 living in income poverty based on IMD data. Using calculations based on this index, in 2019 almost 7,800 (30.7%) children in Blackpool were estimated to be living in income deprived families, compared to 17.1% nationally. This was the highest level in the North West, and second highest nationally (Figure 1).
Figure 1: Income Deprivation Affecting Children Index (IDACI), 2019 - Lower Tier Local Authorities
 Source: OHID Public Health Profiles / Ministry of Housing, Communities & Local Government
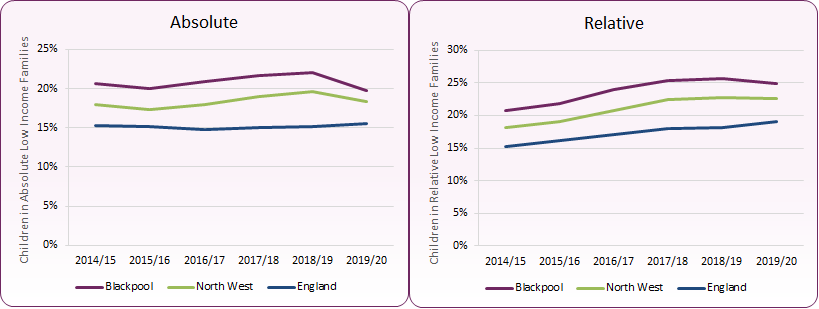
According to data from the Department of Work and Pensions, in 2019/20 an estimated 5,200 (19.8% - LA rank 40th) Blackpool children aged 0-15 lived in 'absolute' low income families (lower than 60% median income before housing costs in comparison with inflation adjusted 2010/11 figures). A total of 6,500 (24.9% - LA rank 35th) were estimated to be living in 'relative' low income families (lower than 60% of the median income each year). Both rates are significantly higher than the national average, and whilst estimates are lower than in 2018/19, the overall trend for those in relative low income families is increasing (Figure 2).
Figure 2: Trend in percentage of children living in absolute and relative low-income families (under 16s)
 Source: OHID, Public Health Profiles / Department for Work and Pensions / HM Revenue & Customs
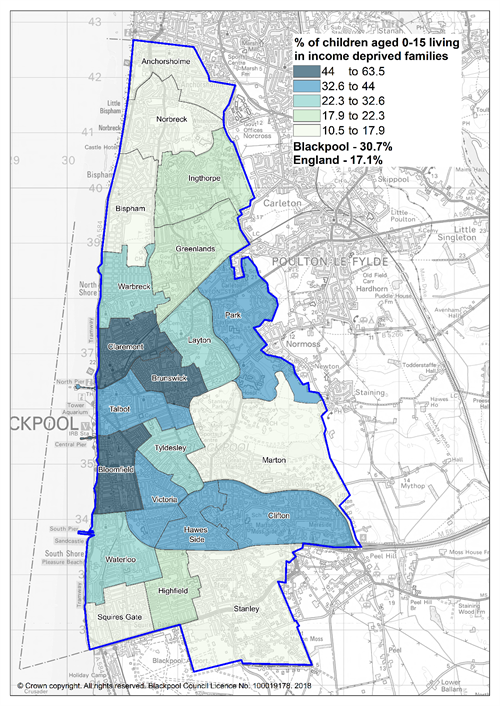
Nine of the 21 wards in Blackpool fall into the most deprived 10% nationally, as measured by the Income Deprivation Affecting Children Index (2019 data). The estimated percentage of children (0-15 years) living in low-income families varies considerably across Blackpool, from 10.6% in Norbreck to 63.4% in Bloomfield (Figure 3).15
Figure 3: Children in low-income families across Blackpool (IDACI) - 2019
 Source: OHID Local Health
Universal Credit
Universal credit is a payment to support living costs for those who are unemployed or on a low income. Universal Credit is operated by the Department of Work and Pensions and replaces the following six working-age benefits with a single payment:
-
- Income Based Jobseeker's Allowance (JSNA)
- Income Related Employment and Support Allowance
- Income Support
- Working Tax Credit
- Child Tax Credit
- Housing Benefit
Universal Credit is still in its implementation phase, with the transition from other benefits expected to be completed by 2024. Caution is needed when interpreting this data due to this transition period and the experimental nature of data. Numbers and rates of people aged 16-64 on Universal Credit in Blackpool rose gradually from 2016, as the programme was introduced, before increasing from 2018 onwards. A more dramatic increase was observed at the start of the initial COVID-19 lockdown period, with numbers peaking around March 2021, when 22,781 individuals (27.2% of the 16-64 population) were on Universal Credit in Blackpool and 15,240 of these were not in employment. By November 2021 this fell to 21,490 (25.6%), with 13,057 not in employment16.
As of November 2021:
-
- There were 15,835 households in Blackpool on Universal Credit (a reduction from 17,159 in March 2021)
- 6,752 households on Universal Credit in Blackpool had one or more children, compared to 6,448 in March 2021.16
Whilst, therefore, the overall number of Blackpool households on Universal Credit has reduced since March 2021, this trend has not been reflected in households with children, where an increase has been observed.
Workless families
Department of Work and Pension data16 shows that in 2018/19:
-
- Of the 5,718 children aged 0-15 living in an absolute low income household, 2,546 (44.5%) lived in a family with no employment
- Of the 6,658 children aged 0-15 living in a relative low income household, 2,763 (41.4%) lived in a family with no employment
In 2019/20:
-
- Of the 6,370 children aged 0-19 living in an absolute low income household, 2,713 (42.6%) lived in a family with no employment
- Of the 7,974 children aged 0-19 living in a relative low income household, 3,256 (40.8%) lived in a family with no employment
Lone parents / carers
Single parents are amongst those vulnerable groups at greatest risk of unemployment due to the demands of balancing working and home life, especially with younger children. Two thirds of all children in poverty are from single parent families.
-
- In 2019/20, 2,860 (45%) of the 6,370 children living in absolute low income households were from lone parent families. 1,818 of these were in families where there was no employment.
- 3,610 (45%) of the 7,974 children in relative low income households were from lone parent families. 2,128 of these were in families where there was no employment.
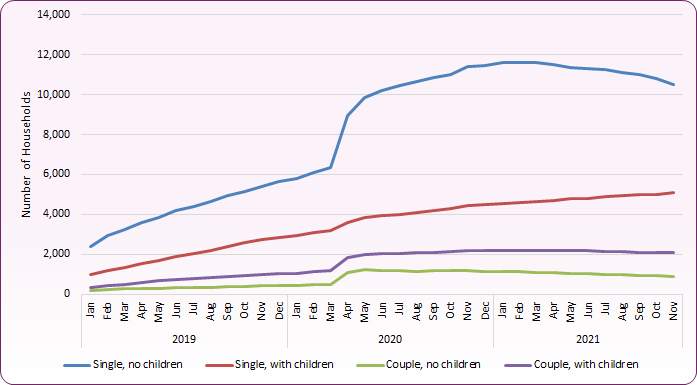
- In November 2021, 4,919 (29%) of the 15,835 households on Universal Credit in Blackpool were recorded as being comprised of a single adult with children.
- Whilst other categories of Universal Credit claimants have reduced following the first 12 months of COVID-19 restrictions, the number of single households with children has continued to rise (figure 3)16.
Figure 4: Blackpool Households on Universal Credit by Household Type, 2017-2021
 Source: Department for Work and Pensions, Stat-Xplore
Examining income support claimants does not paint a full picture of the number of lone parents in Blackpool.
-
- ONS statistics also show that between October 2020 and September 2021, 3,300 people were "economically inactive" due to looking after the family / home.
- Following significant drops in 2007/08 and 2017/18, numbers of people economically inactive due to looking after family / home remained relatively stable at around 3,800 between 2017/18 and 2019/20, rising slightly during the COVID-19 period to March 2021 before dropping to its current level.17
Family size
National statistics indicate that children who live in large families, defined as those with three or more children, are more likely to live in low income households and households in combined low income and material deprivation.
-
- According to statistics reported by HMRC on families claiming child benefit in 2021, Blackpool has 2,590 families with 3 or more children18.
-
- At November 2021, 1,487 households with 3 or more children were on Universal Credit in Blackpool16.
Family Homelessness
Homelessness and experiences of living in temporary accommodation during childhood can adversely affect physical and mental health and development of children, and disrupt schooling. Homelessness during childhood has also been shown to reduce life chances and impact adult employment.19
In 2020/21, 2,577 people approached Blackpool Council for assistance with their housing situation. Of those assessed a total of 1,181 were owed duties under homelessness legislation, while 1,396 were provided with advice and assistance. Of these owed a duty, 852 (72%) were identified as homeless, and owed a duty by the local authority to relieve their homelessness, and 329 (28%) were threatened with homelessness and owed a duty by the local authority to assist in the prevention of the person or family becoming homeless. 51 households with children were identified as homeless and owed a relief duty by the council, whilst 118 households with children were identified as being threatened with homelessness and eligible for preventative support20.
In addition to those families who present to services as at risk of being or actually homeless, the large quantity of poor quality housing in Blackpool means that there are likely to be children living in sub-standard or overcrowded housing although it may be impossible to say how many.
Free school meals and educational attainment
-
- In 2018, 4,741 children were receiving free school meals; 25.3% of all children on the roll. The proportion of children in receipt of free school meals is the eighth highest in the country, significantly higher than the national average of 13.5%.21
- In 2018/19, 58.5% of children in receipt of free school meals had reached a good level of development at the end of reception, above the national average of 56.5%.22
- 31.1% of Year 11 students in Blackpool who were categorised as "disadvantaged" achieved Grade 4 or above in English and Maths GCSEs compared to 60.7% of all other students. Nationally, 44.9% of disadvantaged students achieved Grade 4 or above in English and Maths, compared to 72.1% for all other students.23
Social Mobility
-
- The Social Mobility Index compares the chances that a child from a disadvantaged background will do well at school and get a good job across local authorities of England.
- It examines a range of measures of the educational outcomes achieved by young people from disadvantaged backgrounds and the local job and housing markets to shed light on which are the best and worst places in England in terms of the opportunities young people from poorer backgrounds have to succeed.
- Blackpool was ranked 9th worst performing local authority in the 2016 Social Mobility index.24
- In comparison, our geographical neighbour Fylde is ranked the 22nd best social mobility "hotspot".
Current services and initiatives
Better start
The Better Start Programme aims to improve the life chances of babies and very young children by delivering a significant increase in the use of preventative approaches in pregnancy and first three years of life. By targeting the formative early phase of life, it is hoped that the effects of child poverty may be mitigated.
Selective licencing
The Housing Act 2004 allows local housing authorities to designate areas for Selective Licensing to support the improvement of privately rented properties, providing certain conditions are met. A key element of the scheme is the comprehensive inspection programme which enables the council to identify properties which fall below standards as defined by the housing health and safety rating system, and to offer advice and support to landlords on how they can improve standards. License fees are also used to employ a dedicated antisocial behaviour (ASB) officer whose role it is to offer advice and to support landlords when tackling ASB from their tenants.
From 2019 all privately rented Housing in Multiple Occupation (HMOs) located within the designated area is subject to selective licensing (in additon to existing mandatory licensing). For further information see Blackpool Council Housing Licenses page.
[] PHE Public Health Outcomes Framework, Percentage of all dependent children under 16 in relative low income households, 2019/20
[] Institute for Health Equity; 2010. Fairer Society, Healthy Lives: strategic review of health inequalities in England post 2010
[] Marmot, M., Allen, J., Boyce, T., Goldblatt, P. & Morrison, J. (2020) Health Equity in England: The Marmot Review 10 Years On. Institute of Health Equity.
[] Corlett, A. (2019) The Living Standards Outlook 2019. Resolution Foundation.
[] Corlett, A. & TRy, L. (2022) The Living Standards Outlook 2022. Resolution Foundation.
[] Department for Education, 2011. A new approach to child poverty: tackling the causes of disadvantage and transforming families' lives
[] Welfare Reform and Work Act 2016
[] Children's Commissioner (2021) Child Poverty: the crisis we can't keep ignoring, January 2021.
[] Child Poverty Action Group. The Effects of Poverty [Accessed 16th March 2022]
[] National Education Union. Child Poverty - the facts. May, 2021. [ Accessed 16th March 2022]
[] Joseph Rowntree Foundation (JRF) (2022) UK Poverty 2022: The Essential Guide to Understanding Poverty in the UK. York: JRF.
[] Royal College of Paediatrics and Child Health (2020). State of Child Health. London: RCPCH [Accessed 16th March 2022].
[] Association of Directors of Children's Services (2020) Building a Country That Works for All of Us Post COVID-19: ADCS Discussion Paper. Manchester: The Association of Directors of Children's Services Ltd.
[] Joseph Rowntree Foundation (2021) UK Poverty 2020/21: The leading independent report. London: JRF.
[] Department for Communities and Local Government, 2015. English indices of deprivation 2019
[] Source: Department for Work and Pensions Stat-Xplore / Lancashire Insight
[] Nomis, Official labour market statistics. Economically Inactive - Time series for economically inactive people looking after family/home.
[] HMRC (2021) Child Benefit Statistics: Annual Release, data at August 2021.
[] Child Poverty Action Group. The impact of poverty, 2013
[] Blackpool Council Housing data, 2020/21.
[] PHE Child and Maternal Health Profile, Overview of Child Health, Indicator: Eligible and claiming free school meals
[] PHE Child and Maternal Health Profile, Overview of Child Health, Indicator: School Readiness: The percentage of children with free school meal status achieving a good level of development
[] Department for Education (DfE) (2019) Key Stage 4 Performance 2019 (revised). Students are defined as being disadvantaged in they are known to have been eligible for free school meals in the past six years, if they are recorded as having been looked after for at least one day or if they are recorded as being adopted from care.
[] Social Mobility and Child Poverty Commission Social Mobility Index, 2016