Our Children (Looked After) / Children in Need
Last Modified 21/01/2026 14:24:24
Share this page
Introduction
In Blackpool it is our belief that children are best supported to grow and achieve within their own families. But despite everyone’s best efforts to support families, in exceptional circumstances there are a small number of children for whom it is not in their best interests to be cared for by their immediate family (looked after) or where their experience of parenting means that they are unlikely to thrive, flourish and be healthy (child in need).
'Looked after children' are children and young people for whom the local authority becomes their corporate parent. This means that the local authority is responsible for finding them a safe and stable home. Where it is in the best interests of the child this could be a short-term arrangement whilst the family is supported so that children can safely return home; or this can lead to the child/young person being in our care for the longer term. 'Looked after' is a term introduced in the Children Act 1989 and many legal aspects have been amended or updated in the Children and Families Act 2015.
In Blackpool we do not refer to 'looked after children'. In consultation with children and young people as part of our co-production work, the term we use to describe these arrangements is ‘Our Children’. This reflects a parenting approach founded on relationship-based social work practice and partnership working with our young people and their carers.
A child in need (CiN) is defined under the Children Act 1989 as a child who is unlikely to reach or maintain a satisfactory level of health or development, or their health or development will be significantly impaired, without the provision of services, or the child is disabled.
Facts and figures
'Our Children' - looked after children in Blackpool 2023:1
- At March 31 2023, Blackpool Council was the corporate parent for 539 children and young people, slightly lower than the previous year (figure 1).
- Blackpool has rate of 191 per 10,000 children in our care, just under three times the national average of 71 per 10,000
- Blackpool has the highest rate of children in its care in England, followed by Stoke-on-Trent, North East Lincolnshire and Hartlepool.
- Our Children in Blackpool are significantly more likely to be up to date with their immunisations compared to national levels.
These figures fluctuate throughout the year as new children become Our Children and current children are placed within a permanent arrangement, whether this be with friends or family, being returned home or through adoption. During the year to March 2023 in Blackpool:
-
- 181 children became Our Children
- 251 exited our care
Figure 1: trend in the number of Our Children in Blackpool
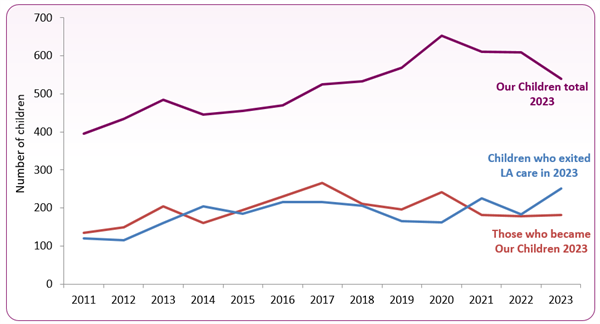
Source: Department for Education. Children looked after in England including adoption: reporting year 2023
Figure 2: trend in the rate of Our Children/looked after children, England, North West and Blackpool
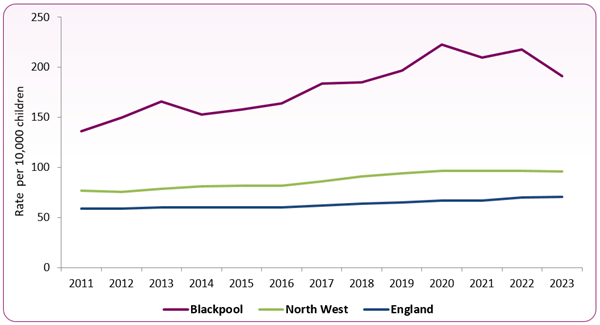
Source: Department for Education. Children looked after in England including adoption: reporting year 2023
Figure 2 shows the trend in the rate of Our Children in Blackpool compared to the North West and England. The chart highlights that Blackpool has significantly higher rates of children in its care relative to the national and regional average. Blackpool also has the highest rate of children in its care compared to all local authorities in England. The majority of authorities with significantly high rates are urban and there is a moderate relationship between the level of deprivation in an area and the corresponding rate of children who are in the care of the local authority.
The demographic profile of Our Children in Blackpool at March 2023 shows:
- We are corporate parents for slightly more males (52%) than females (48%) - similar to regional and national proportions.
- The majority are of white ethnicity (89%) and 9% are of mixed or multiple ethnicities.
- Children aged between 10 and 15 years represent the largest group of Our Children (40%) in Blackpool (England (39%) (figure 3).
- In Blackpool, children under five years old make up a significantly higher proportion of Our Children than the national average: 26% compared to 18% nationally.
- The rate of Our Children aged under-five is just under three times higher than the national average, and for those under the age of one year the rate is around four times higher (figure 4).
Figure 3: age profile of Our Children - proportion of children looked after by age group, 2023
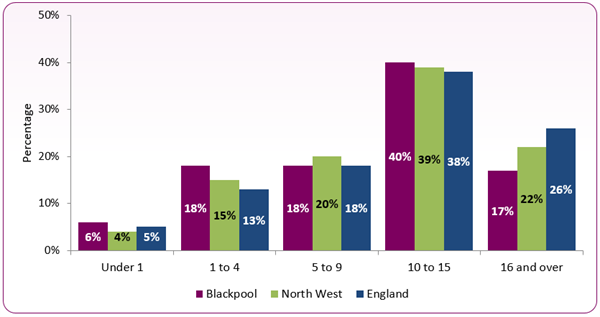
Source: Department for Education. Children looked after in England including adoption: reporting year 2023
Figure 4: Our Children by age group - rate per 10,000 children, 2023
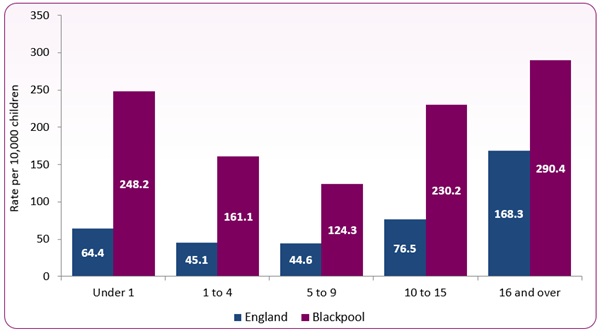
Source: Department for Education. Children looked after in England including adoption: reporting year 2023
Reasons for care
For new children starting to be looked after in 2022/23:1
-
- Abuse and neglect was the largest initial reason for becoming Our Children, 79% of all cases. This is a higher proportion than in recent years (89 in 2022 and 84% in 2021). Nationally, 56% of children entered Local Authority care due to abuse or neglect.
Home type
In terms of where Our Children are placed, Blackpool shows no real difference to the England profile. The largest numbers of homes for Our Children are in foster families, with a remainder placed in children's residential homes and semi-independent living (figure 5).
Figure 5: placement of Our Children, Blackpool and England, March 2023
| Type of placement |
Blackpool (no.) |
Blackpool (%) |
England (%) |
|---|
| Foster placements |
362 |
67% |
68% |
|---|
| Placed for adoption |
20 |
4% |
2% |
|---|
| Placement with parents or others with parental responsibility |
34 |
6% |
7% |
|---|
| Other placement in the community |
19 |
4% |
3% |
|---|
| Secure units, children's homes or semi-independent living |
97 |
18% |
17% |
|---|
| Other residential setting |
7 |
1% |
2% |
|---|
| Other placements |
0 |
-- |
1% |
|---|
| Residential schools |
0 |
-- |
-- |
|---|
Source: Department for Education. Children looked after in England including adoption, reporting year 2023
Children who leave our care through adoption or other routes
In Blackpool, 251 of Our Children ceased to be in our care during the 2022/23 period. 19% of children became subject to a special guardianship order, which confers parental responsibilities to a guardian but does not change the legal relationship of birth parents with their children. The proportion of special guardianship orders issued in Blackpool is significantly higher than the national proportion (12%).
15% of children moved into independent living (7% independent living with no formalised support and 8% with formalised support), 19% returned home to live with parents or relatives with parental responsibility (as part of the care planning process), and 14% were adopted (figure 6).
Figure 6: destinations of those ceasing to be Our Children, March 2023
| Destination |
Blackpool (no.) |
Blackpool (%) |
England (%) |
|---|
| Returned home to live with parents or relatives with parental responsibility |
60 |
24% |
21% |
|---|
| Adopted |
35 |
14% |
9% |
|---|
| Special guardianship orders |
47 |
19% |
12% |
|---|
| Residence order granted |
22 |
9% |
3% |
|---|
| Moved into independent living (with supportive accommodation) |
19 |
8% |
12% |
|---|
| Moved into independent living (with no formalised support) |
18 |
7% |
3% |
|---|
| Sentenced to custody |
0 |
0% |
1% |
|---|
| Left care to live with parents, relatives or other people with no parental responsibility |
10 |
4% |
6% |
|---|
| Aged 18+ and remained with current carer |
8 |
3% |
15% |
|---|
| Care ceased for any other reason |
20 |
8% |
10% |
|---|
Source: Department for Education. Children looked after in England including adoption, reporting year 2023
Adoption is a sensitive area and in Blackpool performance is measured over a number of indicators. In 2022/23, 14% of those ceasing care were adopted, higher than the national average of 9%. Figure 7 shows the number and proportion of adoptions in Blackpool. Recent reductions in both the number and proportion of those adopted may be due to effects of the COVID-19 pandemic (e.g. causing delays in family court proceedings), although the most recent figures for 2022/23 show an increase.2
Figure 7: adoptions 2016 to 2023
| | 2015/16 | 2016/17 | 2017/18 | 2018/19 | 2019/20 | 2020/21 | 2021/22 | 2022/23 |
|---|
| Blackpool (no.) |
46 |
41 |
36 |
30 |
35 |
31 |
16 |
35 |
| Blackpool (%) |
21% |
19% |
17% |
18% |
22% |
14% |
9% |
14% |
| England (%) |
15% |
14% |
13% |
12% |
12% |
10% |
10% |
9% |
Source: Department for Education. Children looked after in England including adoption, reporting year 2023
Outcomes for Our Children
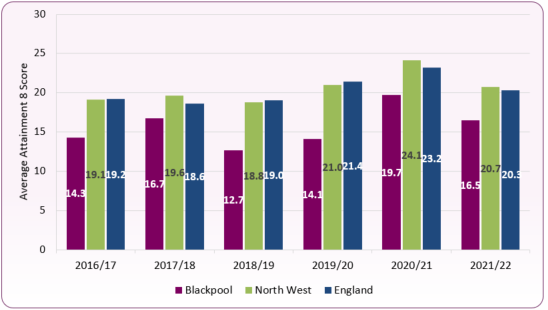
'Attainment 8' measures the average achievement of pupils in up to eight qualifications at the Key Stage 4 educational level, with points allocated according to the grades pupils achieve in subjects (English and maths are double-weighted to signify their importance). A higher overall average score indicates higher educational attainment.
The Attainment 8 score for Our Children in Blackpool is lower than both the North West and England average score (figure 8). This average score is the 20th lowest in the country among local authorities. However, with the exception of 2017/18 and the current year, Blackpool has been in the bottom 10 local authorities for this measure. It should also be noted that Blackpool's Attainment 8 score for all pupils is among the lowest in the country (37.9 compared to 48.8 across England in 2021/22).3 Results for 2019/20 include grades awarded to students when exams were cancelled due to COVID-19, and are not comparable with previous years.
Figure 8: average Attainment 8 score for Our Children/looked after children, academic years 2016/17 to 2021/22
 Source: Office for Health Improvement and Disparities, Child and Maternal Health Profile
Figure 9 shows the number of school-aged children who had been continuously in care for at least 12 months by special educational need (SEN) and the number of school exclusions in the care population.
Figure 9: special educational needs and school exclusions of Our Children/looked after children, 2022/23
| | Blackpool (no.) | Blackpool (%) | North West (%) | England (%) |
|---|
| Special educational needs (SEN)-2022/23 |
|---|
| Number of school-aged children who had been continuously in care for at least 12 months |
302 |
|
|
|
| Number of Our Children /looked after children in care for 12 months with the following provision for SEN: |
No SEN |
147 |
48.7% |
44.0% |
50.0% |
| SEN support |
88 |
29.1% |
27.1% |
21.8% |
| SEN with a statement or education, health and care plan (EHCP) |
67 |
22.2% |
28.8% |
28.2% |
| Total with SEN |
|
155 |
51.3% |
56.0% |
50.0% |
| Exclusions from school-2021/22 |
|---|
| Our Children/looked after children with at least one fixed period exclusion (children in care for 12 months) |
36 |
12.3% |
12.0% |
12.2% |
Source: Department for Education, Outcomes for children in need, including children looked after by local authorities in England, academic year 2022/23
Transition from local authority care - care leavers/care experienced
A care leaver or 'care experienced' person is someone aged between 16 and 25 who has been looked after for at least 13 weeks and are/were in care on or after their 16th birthday.
In 2022/2023:1
-
- 68 (100%) of 17 to 18 year old care leavers were in touch with the local authority (compared to 94% nationally)
- 16 (99%) of the 19, 20 and 21 year old care leavers in Blackpool were in touch with the local authority (compared to 94% nationally).
- The local authority has been in touch with 99-100% of care leavers each year since 2019.
- 60% of Blackpool care leavers aged 17 to 18 were in education, employment or training, compared to 66% across England. 35% were in education and 19% were in training or employment.
- NEET levels for 17 and 18 year old care leavers has decreased from a high of 55% in 2019/20 to 40% (2022/23). Factors affecting this may include changes to the age of compulsory education (with those remaining in education rising from 19% in 2017/18) and the impact of COVID-19.
- 61% of Blackpool care leavers aged 19 to 21 were in education, employment or training (compared to 56% nationally). 41% were in training or employment and 15% were in education other than higher education. Of those who were NEET, 7% was owing to illness or disability, 7% for pregnancy or parenting, and 23% for other reasons.
- The proportion of care leavers aged 19 to 21 years who were NEET (37%) is at its lowest level, a reduction from the high of 57% in 2019/20 (figure 10).
- 96% of 17 to 18 year old and 92% of 19 to 21 year old care leavers were in accommodation considered suitable (compared to national levels of 91% for 17 to 18 year olds and 88% for 19 to 21 year olds).
- 29% of 17 to 18 year old care leavers were living in semi-independent transitional accommodation, 22% in independent living, 10% were living with parents or relatives, and 15% with former foster parents.
- 47% of 19 to 21 year olds were in independent living, 16% living with parents or relatives, and 13% with former foster parents. The proportion recorded as in independent living is significantly higher than the national level (35%).
Figure 10: proportion of care leavers (age 19 to 21 years) who are 'IN' and 'NOT IN' education, employment or training, Blackpool and England, 2018/19 to 2022/23
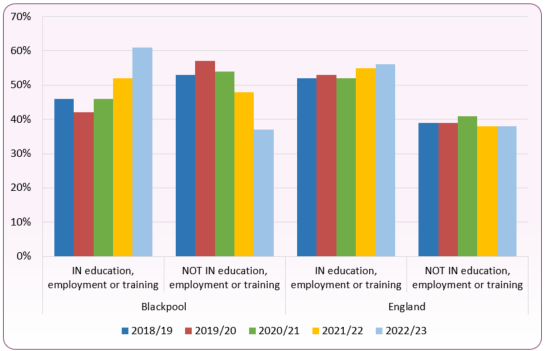 Source: Department for Education, Children looked after in England including adoption, reporting year 2023. Chart does not include unknown EET circumstances (0-1% for Blackpool and 6-7% for England over the last three years)
Children in need (CiN) are a group supported by social care who have a safeguarding and welfare need including:
- children on CiN plans
- children on child protection plans
- looked after children
- disabled children
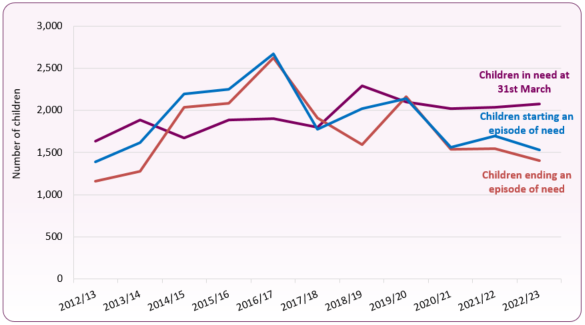
The number of CiN changes frequently throughout the year. New children become in need and current children cease to be in need. A child begins an 'episode of need' when they are referred to children's social care services. Each child in need can have multiple episodes of need within a year.
In Blackpool during 2022/23:4
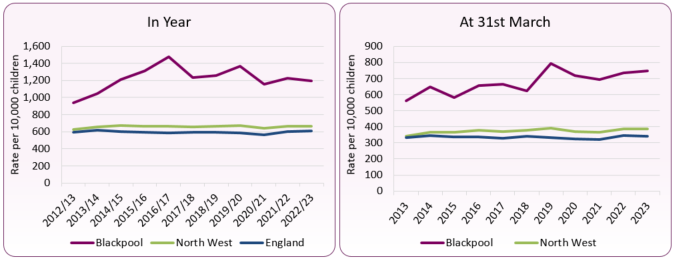
- 3,313 children aged under 18 years had an episode of need at some point throughout the 12 month period. This is lower than the peak of 4,229 in 2016/17.
- The rate of children with an episode of need at any point in the year was 1,191.3 per 10,000 children. This is almost double the national rate of 665.1 per 10,000 children (figure 11).
- At 31 March 2023 there were 2,075 children in need at a rate of 746.1 per 10,000 children. This is over twice the national rate (343.8 per 10,000).
- Blackpool has the second highest rate of CiN in the country (on the basis of 31 March measure).
- 1,534 children started an episode of need in the year (figure 12).
- 1,402 ended an episode of need in the year.
- The total number of recorded episodes of need was 3,572.
Figure 11: trend in the rate of children in need, England, North West and Blackpool (at any point in year and at 31st March)
 Source: Department for Education, characteristics of children in need, reporting year 2023
Figure 12: Trend in the number of children in need in Blackpool
 Source: Department for Education, characteristics of children in need, reporting year 2023. Numbers are based on counts of children (episodes may exceed this since individuals may have multiple episodes in a year)
Concerns about maltreatment may be the reason for a referral to local authority children’s social care or concerns may arise during the course of providing services to the child and family. In these circumstances, local authority children’s social care must initiate enquiries to find out what is happening to the child and whether protective action is required.
A referral is defined as a request for services to be provided by children's social care and is in respect of a child who is not currently 'in need'. A referral may result in: an assessment of the child's need; the provision of information or advice; referral to another agency; or no further action.
Figure 13 compares referral, assessment and child protection plan rates in Blackpool with the North West and England. 2,407 CiN referrals were made in 2022/23 (a rate of 865.5 per 10,000), compared to 3,122 (1,122.6 per 10,000) in 2021/22, 2,739 in 2020/21 (940.9 per 10,000) and a high of 3,819 (1,307.2 per 10,000) in 2019/20. Across Blackpool there were no referrals that resulted in 'no further action' and 23.3% of referrals were within 12 months of a previous referral (compared to 22.4% nationally). 3,063 assessments were completed in 2022/23 (3,789 in 2021/22). The rate of 1,101.4 assessments per 10,000 children for 2022/23 is approximately twice the national average.3
Figure 13: children in need - referrals and assessments 2023
| | Blackpool | North West | England |
|---|
| | Number | Rate/10,000 | Rate/10,000 | Rate/10,000 |
|---|
| Number of referrals during the year |
2,407 |
865.5 |
529.6 |
544.5 |
| Assessments completed by children's social care services |
3,063 |
1,101.4 |
596.6 |
557.4 |
| Episodes with assessment factor information* |
2,612 |
-- |
-- |
-- |
| Children who were subject to:- |
section 47 enquiries** |
940 |
338 |
175.6 |
165.1 |
| an initial stage child protection conference |
389 |
139.9 |
67.6 |
62.3 |
| Children on child protection plans (any time in year) |
660
|
237.3 |
107.2 |
96.3 |
| Children who were the subject of a child protection plan as at 31 March |
356 |
128.0 |
49.1 |
43.2 |
| *assessment factors at end of assessment - excludes those episodes where no factors were identified, ** section 47 refers to enquiries conducted under the provisions of section 47 of the Children Act 1989 |
Source: Department for Education, characteristics of children in need, reporting year 2023
Abuse or neglect was the most common primary need at initial assessment for a child in need. In 2023, 63.2% of children had abuse or neglect as their primary need identified at assessment (compared to 57.4% nationally), followed by family being in acute stress (4.5%) and family dysfunction (4.0%). Around a fifth (20.3%) did not have a primary need stated.
Across Blackpool there were 2,612 assessments where factors could be identified at the end of assessment. The most common factors identified were: mental health of the parent (49.3% compared to 31.7% for England) and domestic violence where the parent was the victim (40.6% compared to 31.5% nationally). Neglect (23.1%, 16.2% England) and the mental health of the child (22.2%, 17.2% England) were also common factors, along with emotional abuse, drug abuse, and alcohol abuse (figure 14).
Figure 14: percentage of children in need by factors identified at the end of assessment, Blackpool, 2023
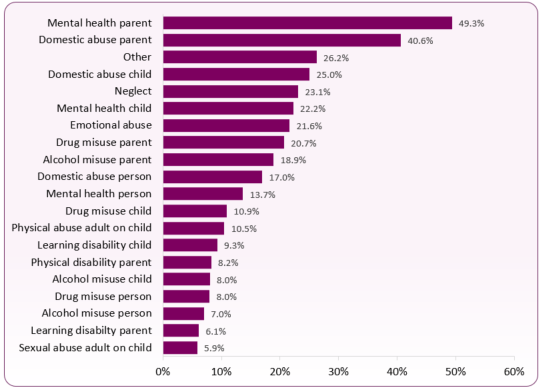 Source: Department for Education. c0haracteristics of children in need, reporting year 2023. Multiple factors can be recorded.
Local authorities, with the help of other organisations as appropriate, have a duty to make enquiries under section 47 of the Children Act 1989 if they have reasonable cause to suspect that a child is suffering, or is likely to suffer, significant harm, to enable them to decide whether they should take any action to safeguard and promote the child’s welfare. There may be a need for immediate protection whilst the assessment is carried out.
At the initial child protection conference the decision is made as to whether the child needs to become the subject of a child protection plan. When a child becomes the subject of a plan, the initial category of abuse is recorded. Plans are then reviewed on a regular basis and a child should no longer be the subject of a plan if it is judged they are no longer at risk or harm.
- During 2022/23, 940 children in Blackpool were the subject of section 47 enquiries, compared to 1,160 in 2019/20 and 869 in Covid-19 affected 2020/21. The 2022/23 Blackpool rate of 338 per 10,000 children is double the national average (165.1 per 10,000).
- At 31 March 2023 there were 356 children with child protection plans (CPPs) in Blackpool at a rate of 128.0 per 10,000 population. This is the second highest rate in the country and over three times the national average (43.2 per 10,000).4
The number of enquiries conducted under Section 47 of the Children Act 1989 and the number of initial stage child protection conferences was lower in both 2022/23 and 2021/22 than previous years, possibly reflecting the impact of COVID-19 restrictions on referrals and risk thresholds for enquiries, though nationally the rate of Section 47 enquiries in 2022/23 increased to its highest level since at least 2013.
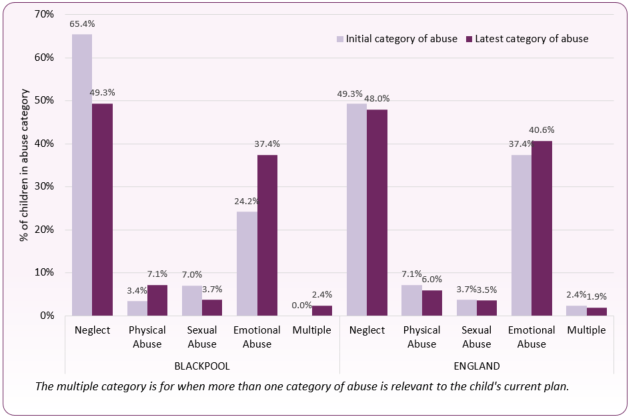
Figure 16 shows the proportion of children on a child protection plan by initial and latest category of abuse. As with the national picture, neglect and emotional abuse are the main categories of abuse for children with CPPs, though the proportion reported to be experiencing neglect is higher in Blackpool.
Figure 16: The proportion of children on a child protection plan at 31st March 2022 by initial and latest category of abuse, Blackpool and England
 Source: Department for Education. Characteristics of children in need, reporting year 2023
National and local strategies
In February 2023 the UK Government released Stable Homes, Built on Love: Implementation Strategy and Consultation, outlining children's social care reforms. These reforms focus on a series of key pillars, including providing the right support at the right time (including early help); a decisive multi-agency child protection system; unlocking the potential of family networks; putting love, relationships and a stable home at the heart of being a child in care; valued and skilled social workers for every child who needs one; and a system that learns and improves.
Working together to safeguard children 2023: statutory guidance (publishing.service.gov.uk) covers the legislative framework placed on services and sets out frameworks for inter-agency cooperation in order to safeguard children and young people. The 2023 document replaces the previous 2018 guidance.
Promoting the health and well-being of looked-after children. Statutory guidance on the planning, commissioning and delivery of health services for looked-after children (Department of Health and Social Care, and Department of Education, 2022)
The Childcare sufficiency assessment - 2023 - 2024 sets out how Blackpool Council intends to meet the sufficiency duty. It also emphasises the council’s commitment to children and young people who are in the care of the local authority or on the edge of care to ensure that their life chances and outcomes are improved.
Department for Education. Children looked after in England including adoptions, reporting year 2023.
Community Care, Children adopted from care falls to lowest in 21 years, government figures show. November 22, 2021 [accessed 30 March 2022].
Department for Education. Outcomes for children in need, including children looked after by local authorities in England, reporting year 2023.
Department for Education, Characteristics of children in need, reporting year 2023.