Ethnicity
Last Modified 28/03/2023 10:56:11
Share this page
The 2021 Census indicates that a significantly smaller percentage of ethnic minority groups live in Blackpool compared to the North West and England.
90.4% of the Blackpool population identified as 'white UK' (or White English, Welsh, Scottish, Northern Irish or British) compared to 81.2% in the North West and 73.5% in England. 9.6% of the Blackpool population are therefore considered as being in an ethnic minority group (including those in white minority groups such Polish, Irish, Romanian, Roma, Gypsy or Irish Travellers, and those from other countries outside the UK)1 compared to 18.8% in the North West and 26.5% in England.
94.7% of the Blackpool population identified as 'white', compared to 85.6% in the North West and 81% in England (Figure 1). 5.3% of the Blackpool population are therefore considered to be in ethnic minority groups other than white, compared to 14.4% in the North West and 19% in England.
The proportion of those identifying their ethnic group as 'White English, Welsh, Scottish, Northern Irish or British' across England has decreased since censuses in 2001 and 2011. This trend is reflected locally, though the proportion of white and / or white UK residents in Blackpool remains significantly higher than regional or national levels.
Figure 1 - Estimated resident population by ethnic group, Census 2021
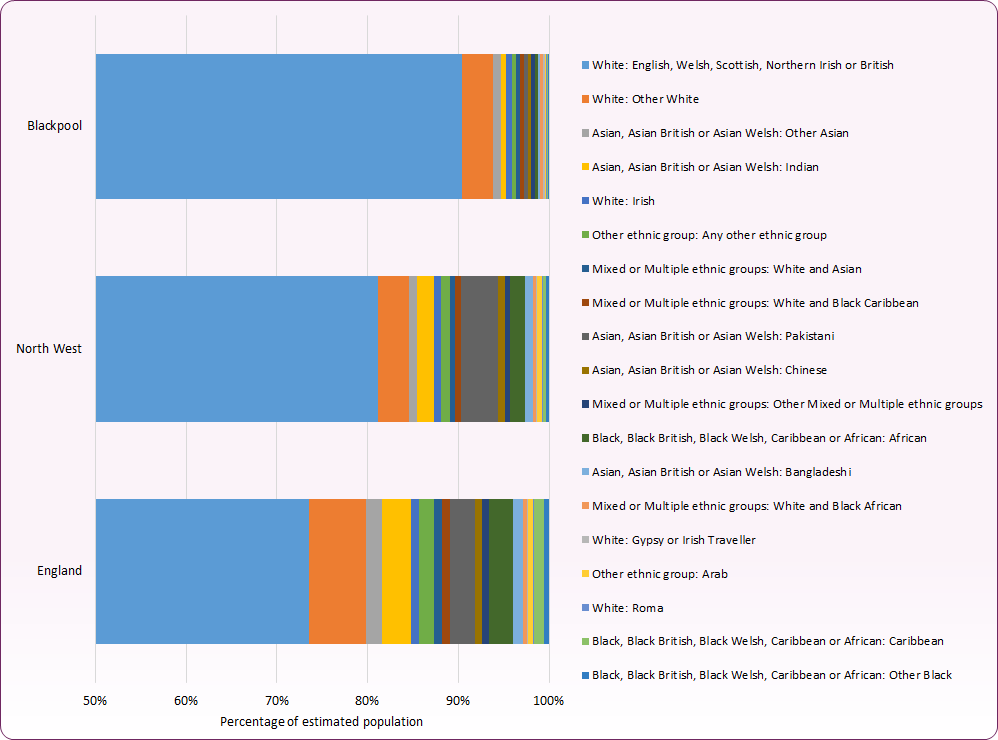 Source: Office for National Statistics (ONS), Census 2021 (note chart proportions commence at 50% to show minority groups in more detail)
Figure 2 - 2021 Estimated Resident Population by Ethnic Group
|
|
Blackpool
|
North West
|
England and Wales
|
|
Ethnicity
|
Persons
|
%
|
Persons
|
%
|
Persons
|
%
|
|
White
|
133,550
|
94.7%
|
6,347,394
|
85.6%
|
45,783,401
|
81.0%
|
|
Mixed
|
2,210
|
1.6%
|
163,245
|
2.2%
|
1,669,378
|
3.0%
|
|
Asian or Asian British
|
3,676
|
2.6%
|
622,685
|
8.4%
|
5,426,392
|
9.6%
|
|
Black or Black British
|
711
|
0.5%
|
173,918
|
2.3%
|
2,381,724
|
4.2%
|
|
Other ethnic group
|
892
|
0.6%
|
110,156
|
1.5%
|
1,229,153
|
2.2%
|
Source: Office for National Statistics (ONS), Census 2021
16 of Blackpool's 95 Lower Super Output areas have an ethnic minority population (including non-British white ethnic groups) of 15% or more of the overall population for that area (as shown in Figure 3). The ethnic minority groups within Blackpool are predominantly of Eastern European and Asian background. The largest single ethnic group other than 'white UK' residents is white Polish (1.3% of total population).
Figure 3 - Proportion of ethnic minority groups (including non-British white populations) living in Blackpool, by Lower Super Output Area (and ward boundaries)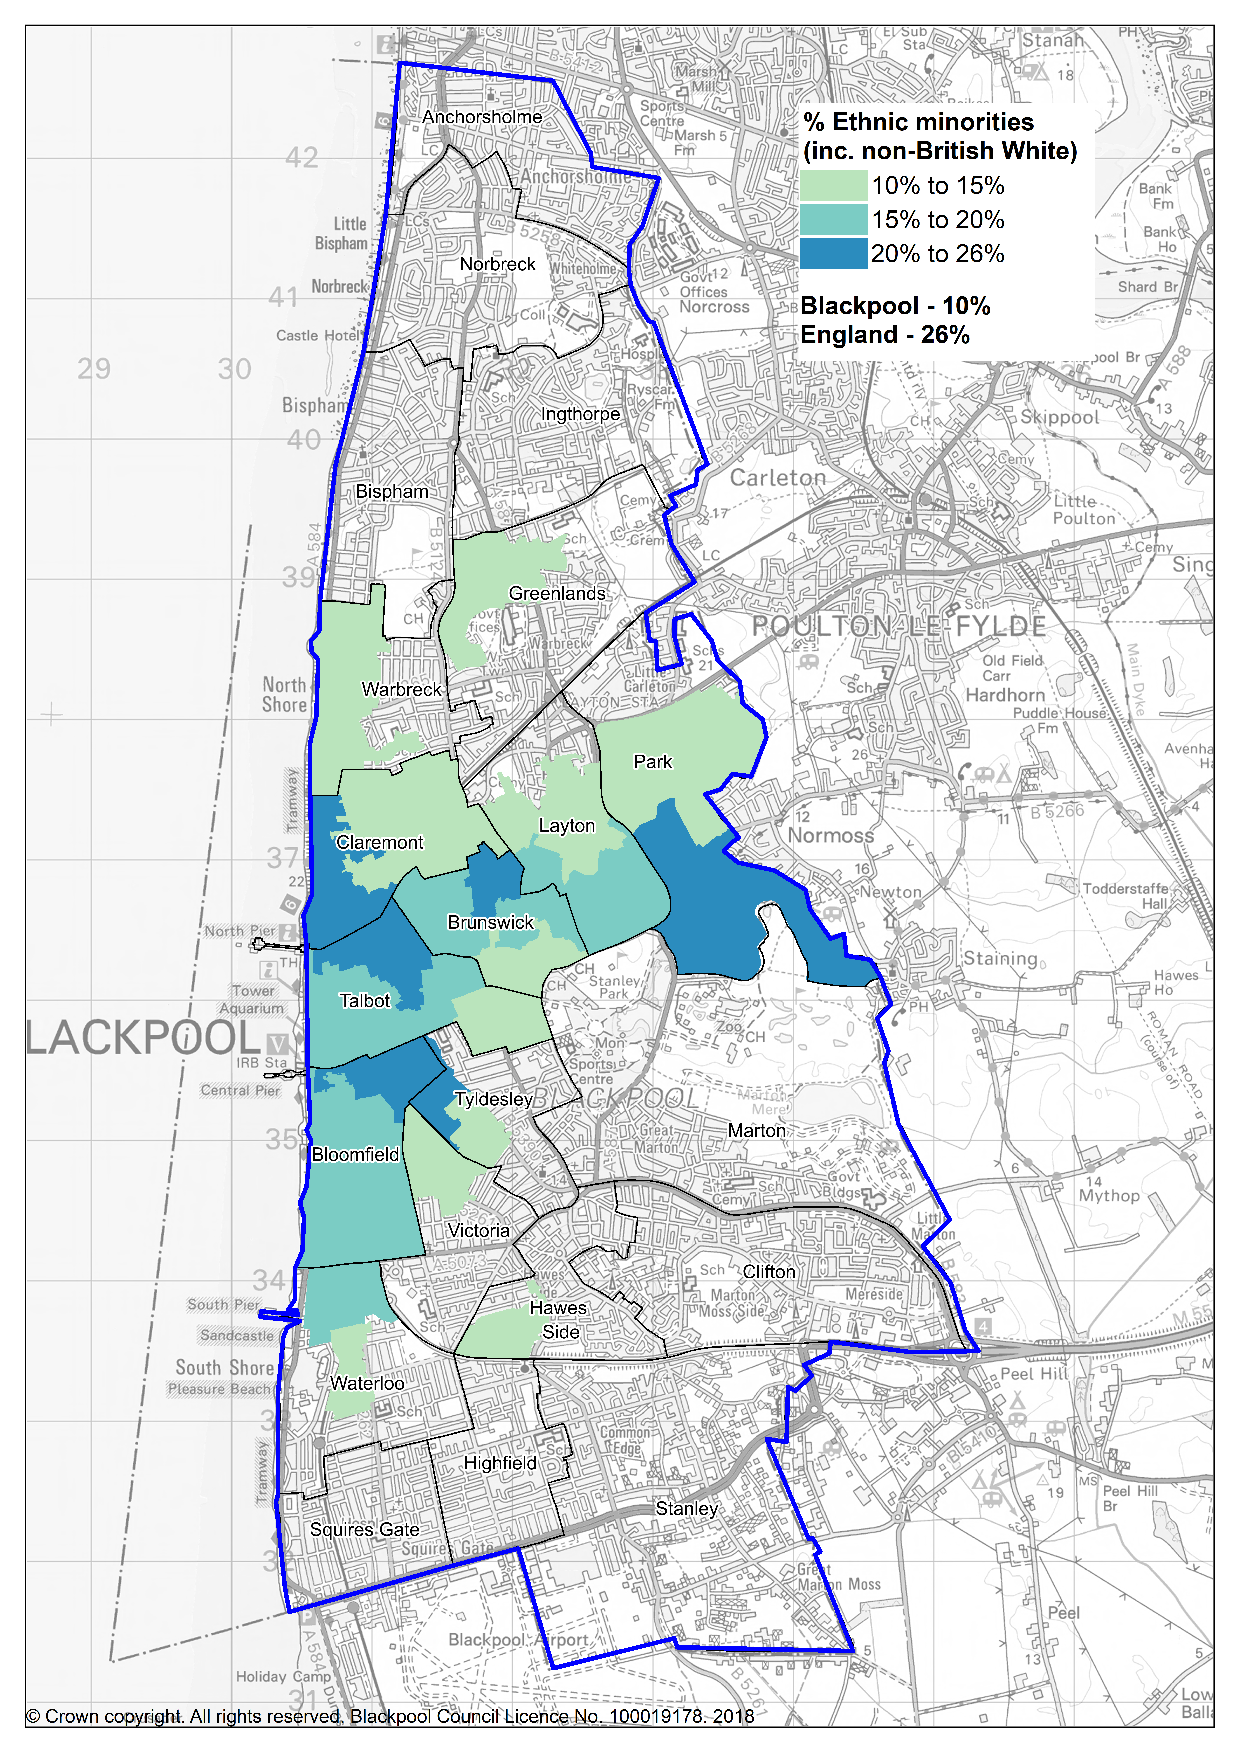 Source: Office for National Statistics (ONS), Census 2021
[1] ‘Ethnic minorities’ refer to all ethnic groups except the white UK group. Ethnic minorities include white minorities, such as Gypsy, Roma and Irish Traveller groups - see Gov.uk Ethnicity Facts and Figures for futher information.