Mortality
Last Modified 28/03/2023 09:16:25
Share this page
Mortality is a measure of the number of deaths for people resident within a particular geographical area. A mortality rate (in this case per 100,000 population) is calculated to allow comparison between areas of different population sizes and with different gender and age make ups.
Comparison with similar local authorities is useful as it can trigger discussion about why there are different levels of outcomes locally. Therefore, local authorities have been grouped into geographically similar categories based on the Chartered Institute of Public Finance and Accountancy (CIPFA) nearest neighbour model methodology which compares areas with the most similar statistical characteristics in terms of social and economic features. Figures 1 to 3 include CIPFA statistical neighbourhood averages to add context to the trend in Blackpool's mortality rate. The local authorities with similar characteristics to Blackpool can be found on the Public Health Outcomes Framework.
Infant mortality is also an indicator of the general health of an entire population. Deaths occurring during the first 28 days of life (the neonatal period) in particular, are considered to reflect the health and care of both mother and newborn.
All Age All-Cause Mortality (AAACM)
All age all-cause mortality is a measure of mortality that includes deaths from any cause for people of all ages.
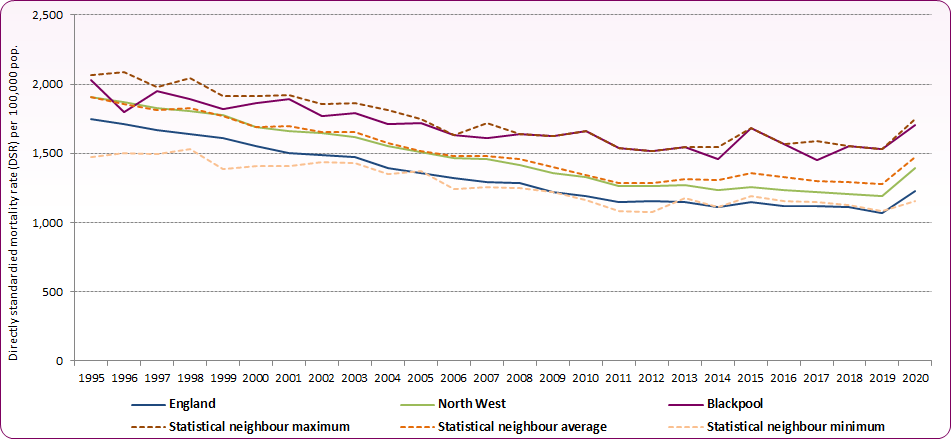
Figure 1 shows the mortality rate for males in Blackpool has been falling consistently over a 20 year period. While the trend is generally downward, Blackpool's male AAACM rate has not fallen as quickly as either the rate for the North West or England as a whole. In the late 1990s Blackpool's male AAACM rate was similar to a number of its statistical neighbours, but Figure 1 shows that Blackpool's rate has not kept pace with the average reduction in mortality seen elsewhere and Blackpool has generally had the highest male mortality rate of those statistical neighbours since 2009.
Figure 1: All Age, All Cause Mortality - Males, 1995 to 2020, Blackpool and Statistical Neighbour averages
 Source: NHS Digital Indicator Portal and ONS Deaths registered by area of usual residence (NOMIS), 2020
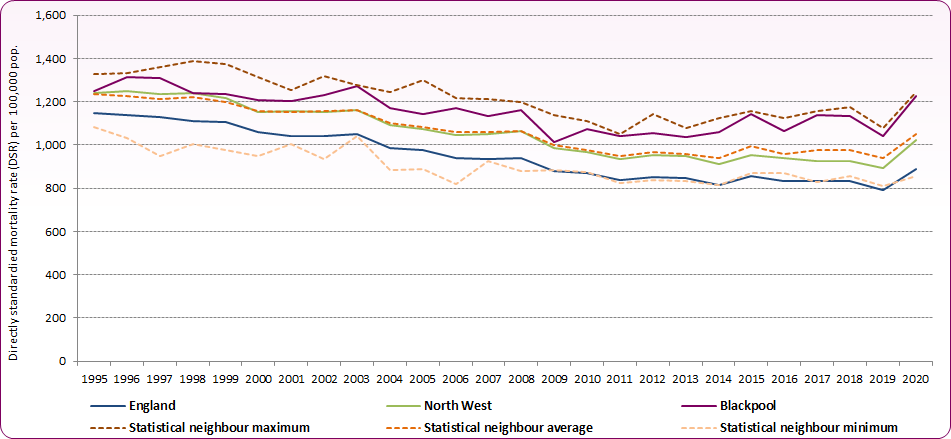
Figure 2 shows the mortality rate for females in Blackpool had been falling consistently and at a similar rate to the North West and England since the early 2000s. However, the trend has levelled off in Blackpool while rates continue to fall nationally and regionally. Blackpool's female mortality rate had also broadly fallen at a similar rate to its statistical neighbour average but has now risen above this.
Figure 2: All Age, All Cause Mortality - Females, 1995 to 2020, Blackpool and Statistical Neighbour averages
 Source: NHS Digital Indicator Portal and ONS Deaths registered by area of usual residence (NOMIS), 2020
Mortality statistics for 2020 reflect the impact of COVID-19 on the population. In Blackpool the number of COVID-19 deaths quickly came to a peak in mid-April 2020 with a slower fall over summer before increasing again from mid-October and falling through March 2021. While Blackpool's COVID-19 mortality rate is higher than the England rate it is similar to the average rate for the North West region as a whole (see Blackpool Coronavirus Summary). Directly Standardised Mortality Rates are currently unavailable for the 2021 period, however, the overall number of deaths in Blackpool was similar to 2020 with a slight increase in male deaths and decrease in female deaths.
Mortality Aged Under 75
Mortality aged under 75 (premature mortality) is a measure of mortality that includes deaths from any cause for people aged under 75. A child born in England today can expect to live a longer, healthier life than ever before, yet they still have a one in three chance of dying before they reach 75. Of all the factors affecting chances of premature mortality, location is one of the most important. Even in England today, how long we live depends greatly on where we live1.
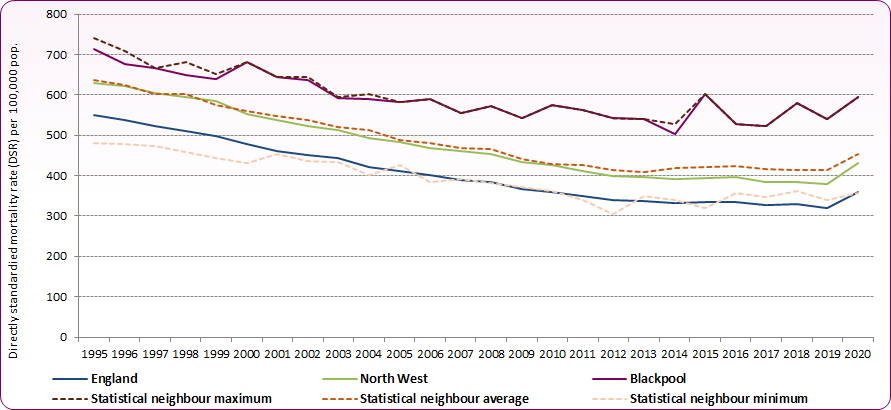
Figure 3 demonstrates that in the last 10 years mortality in people aged under 75 in Blackpool has remained at broadly the same rate since the mid 2000's. In contrast, the rate in the North West, England and for Blackpool's statistical neighbours continued to fall during this period. Blackpool's mortality rate in under 75 year olds is now a clear outlier and is the largest contributor to Blackpool's low overall life expectancy. As with all-age mortality, the impact of COVID-19 is evident in 2020 data, with an increase in mortality rate both local and nationally.
Figure 3: Under 75 Mortality - All persons, 1995 to 2020, Blackpool and Statistical Neighbour averages
 Source: NHS Digital Indicator Portal and OHID, Mortality Profile
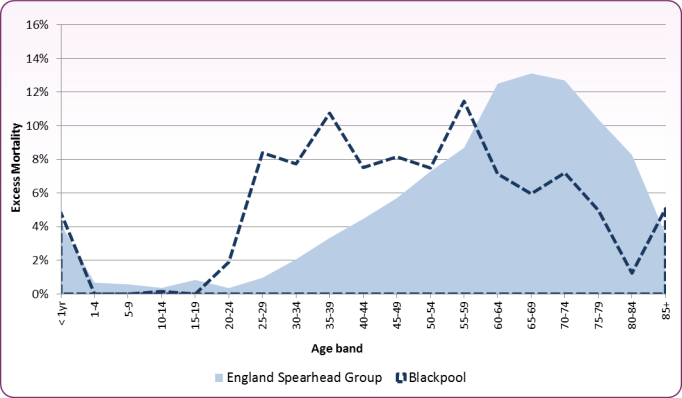
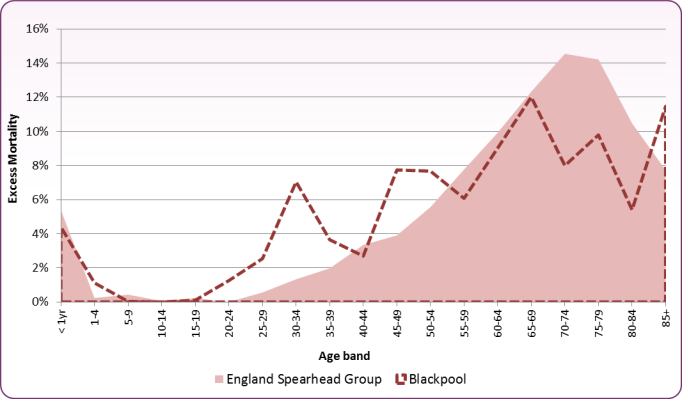
Figure 4 and figure 5 display Blackpool's excess mortality by age band compared to the 62 Primary Care Trusts with the worst life expectancy in the country (commonly referred to as spearhead PCTs). Excess mortality describes those deaths that are above what can be expected when compared to the mortality profile of England. This demonstrates that Blackpool has a much higher proportion of its excess mortality in younger age bands, and this difference is particularly marked in males. This high rate of mortality for males in younger age bands explains the high mortality rate seen in under 75 males in figure 3. These deaths in younger age bands are largely due to suicide and diseases associated with alcohol dependence, drug use and smoking.
Figure 4: Excess male mortality (%) - Blackpool vs. All Spearheads - 2006-08
 Source: London Health Observatory
Figure 5: Excess female mortality (%) - Blackpool vs. All Spearheads - 2006-08
 Source: London Health Observatory
Overall, death rates (for all ages and all causes) have been falling in recent years. Death rates have also been falling for the two most common causes of death, circulatory diseases and cancer, which jointly make up almost 60% of all deaths. Although this shows positive progress, death rates in Blackpool are higher than average and have not been falling as quickly as elsewhere. Death rates need to be reduced more quickly than average in Blackpool.
Avoidable, Preventable and Treatable Mortality
'Avoidable mortality' is defined as deaths that were either preventable or treatable (amenable to healthcare) and is based on those aged under 75 years. Following a recent review, the Office of National Statistics revised mortality definitions to be internationally consistent and comparable. The OECD (2019) defines preventable and treatable causes of mortality as follows:
-
Preventable mortality: Causes of death that can be mainly avoided through effective public health and primary prevention interventions (i.e. before the onset of diseases / injuries, to reduce incidence).
-
Treatable (or amenable) mortality: Causes of death that can be mainly avoided through timely and effective health care interventions, including secondary prevention and treatment (i.e. after the onset of diseases, to reduce case-fatality).
|
The Public Health Outcomes Framework contains the outcome measure - EO3: 'Under 75 mortality rate from causes considered preventable', whilst the NHS Outcomes Framework identifies outcomes related to treatable mortality - 'Potential Years of Life Lost from Causes Amenable to Health Care' (Outcomes 1a.i and 1a.ii).
Although local authority Public Health may focus on the indicator included within the Public Health Outcomes Framework and the Clinical Commissioning Group (CCG) may focus its attention on the indicator included within the NHS Outcomes Framework, a collaborative approach to both prevention and treatment is important. The causes of mortality within both measures are sensitive to preventative interventions, early diagnosis and high quality health care.
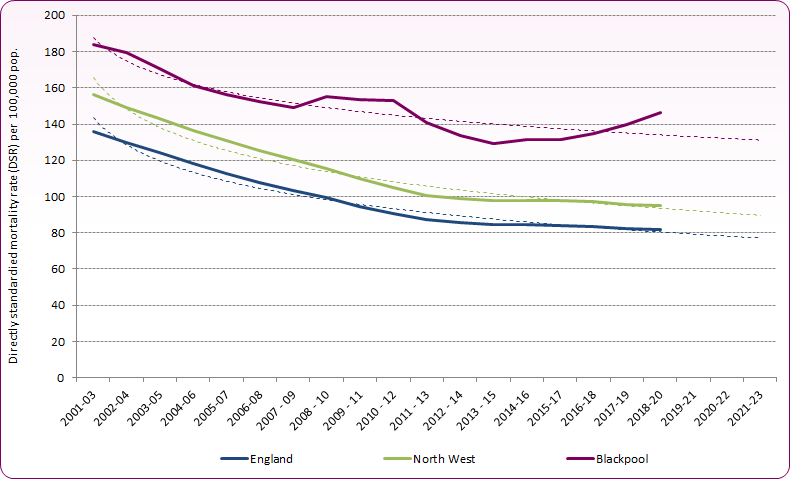
Figure 6 shows Blackpool's mortality rate from causes considered preventable. This fell in parallel with the North West and England as a whole until 2012-14 when the rate started to rise in Blackpool before levelling off once more. In the pre-Covid period of 2017-2019, Blackpool's mortality rate from causes considered preventable was the highest of any local authority in England. The 2018-2020 three-year period begins to show the impact of COVID-19 (which is defined as a preventable cause of death), with increases in rates for Blackpool, the North West and England.
Figure 6: Under 75 Mortality from Preventable Causes (Persons): 2001-03 to 2018-20 (2019 Definition)
 Source: Office for National Statistics, Avoidable mortality by local authorities in England and unitaries in Wales, 2001 to 2020
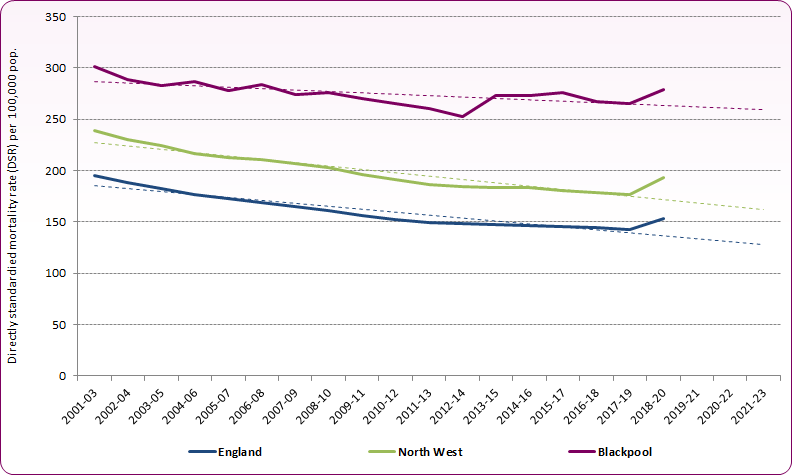
Figure 7 shows Blackpool's mortality rate for causes considered treatable. England and North West average rates steadily declined between 2001 and 2011/12 before levelling off. Blackpool's rate also generally declined (with exceptions between 2008-12) until around 2014. Since that time the rate has increased whilst regional and national rates continue to slowly reduce.
Figure 7: Under 75 Mortality from Treatable Causes (Persons): 2001-03 to 2018-20 (logarithmic trendline)
 Source: Office for National Statistics, Avoidable mortality by local authorities in England and unitaries in Wales, 2001 to 2020
[] Office for Health Improvement and Disparities, Mortality Profile
[] NHS Outcome Framework Indicators 1a.i and 1a.ii for Potential years of life lost (PYLL) from causes considered amenable to healthcare (adults and children / young people) had no updates since 2014. Methodology is recognised as requiring review, however "this is not being actively progressed at this time".