Population
Last Modified 14/03/2024 12:32:28
Share this page
Blackpool Census 2021 facts and figures
The Office for National Statistics (ONS) has published a local area webpage for Blackpool, drawn from the Census 2021 and other sources. Maps and local profiles about Blackpool's population, health and the economy can be found at https://www.ons.gov.uk/visualisations/areas/area/?code=E06000009.
Census 2021 population estimates for Blackpool are available here.
Mid-year population estimates 2022
Mid-year population estimates for England and Wales are produced by the Office for National Statistics (ONS). Estimates are produced by updating a census base; the previous year's resident population is aged by one year, and then flows are applied to cover births, deaths, immigration, emigration and people entering and leaving "special populations", such as people in prisons or the armed forces.
According to the 2022 mid-year estimates, the usual resident population of Blackpool is approximately 141,600. This is an increase of 0.4% from the 2021 mid-year estimates; the overall population of England increased by 1% and the North West increased by 1.2% over the same period. Neighbouring Fylde and Wyre also saw population increases of 1.5% and 2.1% respectively.
Blackpool is the third most densely populated local authority in the North West, with 4,060 people per square kilometre (compared to 4,920 in Manchester, 4,442 in Liverpool, 501 in neighbouring Fylde, and 407 in Wyre).
Estimates indicate that older people (65 years plus) account for a greater proportion of Blackpool's resident population than is observed nationally (figure 1). Since the 2011 census there has been a 7.6% increase in the number of people aged 65 and over in Blackpool, compared to a national increase of 3.6%. The Blackpool population of people aged 15 to 64 years has decreased by 2.8%, compared to a 3.6% increase nationally; and the population of those under 15 years of age has decreased by 2.1% since 2011, compared to an increase of 5% nationally.
Figure 1: 2022 population - males and females, all ages, 0-14 years and 65 and over
| | Total population | Males | Females | Age 0-14 years | Age 65 and over |
|---|
| | No. | No. | % | No. | % | No. | % | No. | % |
|---|
|
England
|
57,106,398
|
27,983,290
|
49%
|
29,123,108
|
51%
|
9,904,245
|
17.3%
|
10,4629,867
|
18.6%
|
|
Blackpool
|
141,574
|
70,014
|
49.5%
|
71,560
|
50.5%
|
23,453
|
16.6%
|
29,465
|
20.8%
|
| Source: Office for National Statistics, Estimates of the population for England and Wales, November 2023 |
Figure 2 gives Blackpool population estimates by males and females and by five-year age group. People aged 50-59 make up 15.1% of Blackpool's population (13.5% nationally). 21.9% of Blackpool's population is aged under 20 (23.1% nationally), and 10.1% are aged 75 and above (9% nationally). Overall, there are significantly more people aged over 50 in Blackpool (42.9%) than is seen nationally (38.1%).
There have been some significant changes to the age distribution of the estimated population since the last census in 2011. The 55-59 age group increased by 31% over the period, the 50-54 age group by 9%, and the 30-34 group by 22%; though 40-44 and 45-49 age groups decreased by 22% and 27% respectively. Increases are also seen in the 70-79 age groups, with decreases in all under 25 age groups except the 5-9-years.
Figure 2: 2022 mid-year population estimates by sex and age group - Blackpool
| | Males | Females | Persons | % |
|---|
| All ages |
70,014 |
71,560 |
141,574 |
|
|---|
| 0-4 |
3,723 |
3,592 |
7,315 |
5.2% |
|---|
| 5-9 |
4,075 |
3,943 |
8,018 |
5.7% |
|---|
| 10-14 |
4,146 |
3,974 |
8,120 |
5.7% |
|---|
| 15-19 |
3,993 |
3,527 |
7,520 |
5.3% |
|---|
| 20-24 |
3,606 |
3,520 |
7,126 |
5.0% |
|---|
| 25-29 |
3,961 |
4,415 |
8,376 |
5.9% |
|---|
| 30-34 |
4,594 |
4,917 |
9,511 |
6.7% |
|---|
| 35-39 |
4,341 |
4,638 |
8,979 |
6.3% |
|---|
| 40-44 |
3,919 |
3,941 |
7,860 |
5.6% |
|---|
| 45-49 |
3,958 |
4,044 |
8,002 |
5.7% |
|---|
| 50-54 |
5,191 |
5,124 |
10,315 |
7.3% |
|---|
| 55-59 |
5,629 |
5,433 |
11,062 |
7.8% |
|---|
| 60-64 |
5,084 |
4,821 |
9,905 |
7.0% |
|---|
| 65-69 |
4,044 |
3,892 |
7,936 |
5.6% |
|---|
| 70-74 |
3,545 |
3,735 |
7,280 |
5.1% |
|---|
| 75-79 |
3,039 |
3,363 |
6,402 |
4.5% |
|---|
| 80-84 |
1,771 |
2,269 |
4,040 |
2.9% |
|---|
| 85-89 |
956 |
1,531 |
2,487 |
1.8% |
|---|
| 90+ |
439 |
881 |
1,320 |
0.9% |
|---|
Population pyramid
Blackpool's population pyramid (figure 3) shows the differences across the age groups compared to England, with higher proportions of those aged 50 and over in Blackpool (males and females). There are lower proportions in ages 50 and younger. Blackpool reflects England's higher proportion of females in the older age bands than males.
Figure 3: Mid year 2022 population pyramid - Blackpool and England
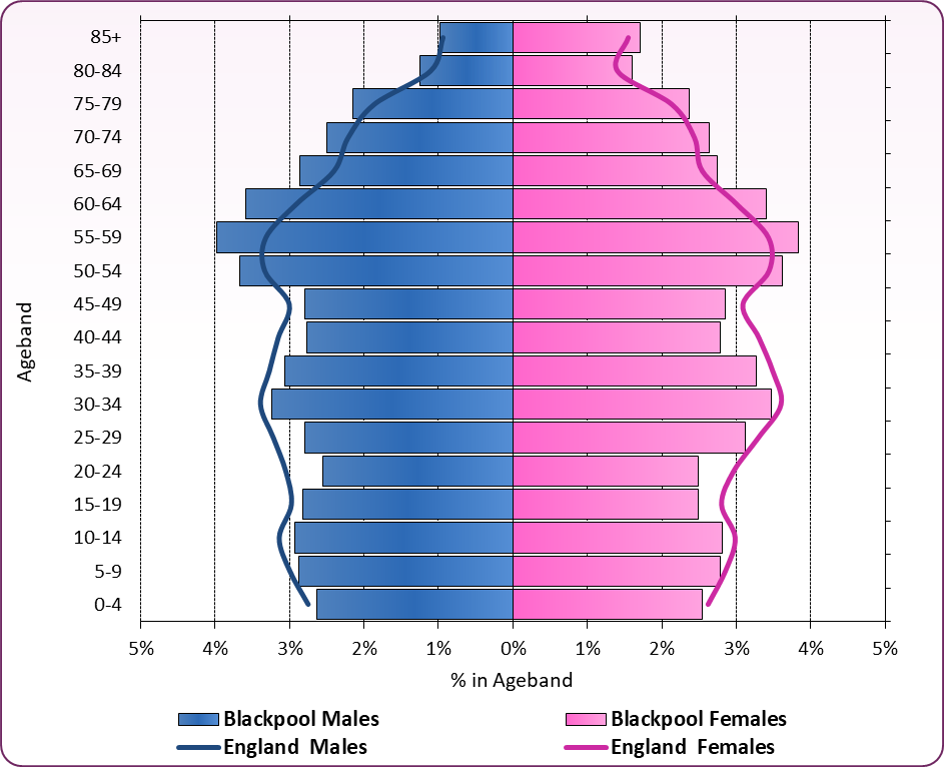 Source: ONS, Population estimates for England and Wales: mid-2022, November 2023
Household composition
Figure 4 and figure 5 show the household composition and household size for Blackpool from the 2021 Census. Blackpool has more single-person housholds compared to North West and England, reflecting the housing stock and population of the area. Almost a quarter (24.8%) of Blackpool's households have dependent children (North West 28%, England 28.5%). Of these, 9% are lone parent households (North West 7.7%, England 6.9%). The interactive map provides further breakdowns.
Figure 5: Household size - Blackpool, North West and England, 2021
| | Blackpool | North West | England |
|---|
| Number of households |
64,367 |
3,009,549 |
22,063,368 |
| One person |
38.0% |
32.2% |
30.1% |
| Two people |
32.4% |
33.5% |
34.2% |
| Three people |
14.5% |
15.7% |
15.6% |
| Four people |
9.9% |
12.2% |
13.0% |
| Five people |
3.6% |
4.3% |
4.7% |
| Six or more people |
1.6% |
2.1% |
2.4% |
Source: NOMIS - official Census statistics (TS003 - household composition)
|
Population projections
Note: The following sections are based on pre-Census 2021 population estimates, and will be revised upon further ONS Census 2021 releases.
Projections for Blackpool show the number of residents over-65 will increase considerably within the next 25 years, far in excess of the levels shown in all other age bands (figure 6). The over-65 population is projected to rise by 24% from 28,400 in 2018 to almost 36,000 in 2039 and will then make up over a quarter (26%) of Blackpool's total population.
The total population is projected to increase slightly in the long term, going from 139,300 in 2018 to 141,500 by 2044 (ONS mid-2018 based population estimates). The 45-64-year-old population shows the greatest decrease over time.
Figure 6: 2018-based subnational population projections for Blackpool
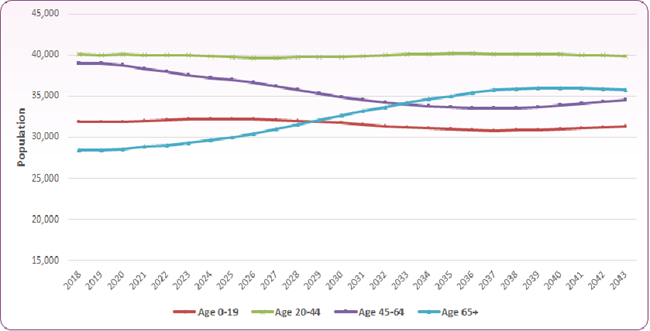 Source: ONS 2018-based subnational population projections
There are four factors that affect population change: birth rate, death rate, immigration and emigration. The difference between the number of births and the number of deaths is the net change in population due to natural change. Immigration and emigration figures reflect those entering or leaving Blackpool from or to other areas of England, the UK or internationally. Figure 7 displays projected changes in Blackpool's population from natural change, immigration and emigration. The main contributory factor in the initial fall in population is that natural change is relatively static with more deaths than births in the town, with the decrease in population partly offset by a small increase in immigration. The levelling off in the late 2020's followed by a projected population rise is primarily due to immigration increasing rather than increase in natural change. ONS data suggests that over 90% of immigration comes from other areas of England and the rest of the UK, with this proportion expected to increase to 95% by the early 2030s.
It should be noted that the population projections are based upon 2018 estimates by the Office for National Statistics, and do not anticipate effects of Brexit or Covid-19 on the population. Both these factors may impact on natural change and immigration over the short, and potentially longer term.
Figure 7: projected components of population change - Blackpool
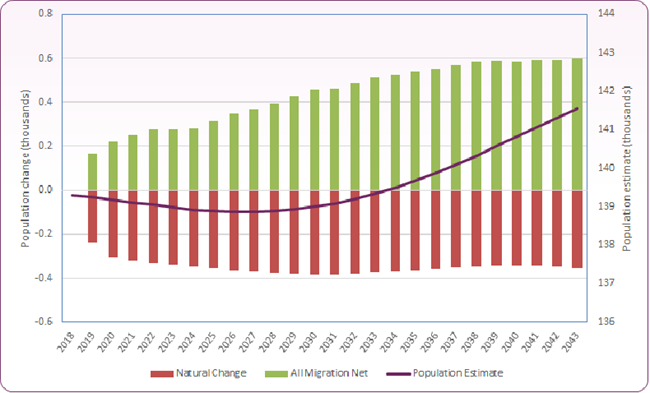 Source: ONS 2018-based subnational population projections
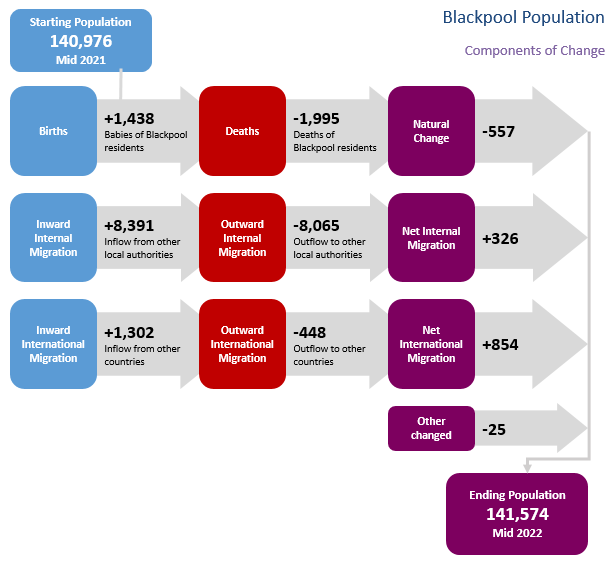
Population turnover statistics show that inward international migration acounts for much of the increase in Blackpool's resident population between 2021 and 2022. Although across England, local authorities with higher education establishments see large population increases due to international migration this is probably not the case for Blackpool. A high proportion of the inward international migration may be people coming to work in the health and socal care sector and tourism as well as some asylum seekers placed within the authority.
Figure 8 summarises the inflows and outflows in Blackpool over the course of a single year.
Figure 8: Population inflows and outflows in Blackpool - mid-year 2021 to 2022 change
MOSAIC is a demographic profiling tool that is produced by Experian. MOSAIC categorises all households and postcodes into 'segments'. Each segment shares a set of statistically similar behaviours, interests or demographics. MOSAIC is especially useful for providing insight into the local population, service users and neighbourhoods, and can be used to support sophisticated service development - right through from initial feasibility research into service design and marketing.
The most recent version of MOSAIC was released in 2023. Households are categorised by 15 broad MOSAIC 'groups'. These groups can be further broken down into 66 detailed MOSAIC 'types'. Each group or type has an associated name and a detailed statistical profile. It is these profiles that paint a rich picture of the segments and provide insight into the local population.
Clearly not every one of the country's postcodes/households matches exactly to just one of the 66 different Mosaic types. These descriptions are what sociologists describe as 'ideal types', pure examples to which individual cases approximate only with various degrees of exactness. They focus on the statistical bias of a type of neighbourhood, on the demographic categories which are more numerous there than elsewhere in the country and which give the neighbourhood its distinctive character. In addition, because the boundaries of postcodes and census output areas do not exactly match boundaries in housing type, it is inevitable that addresses close to boundaries may in certain cases not appear to have been allocated to the most suitable category. There are cases too, where the same types of neighbourhood will contain people of similar character and behaviour but living in very different types of accommodation according to where in the country they may live.1
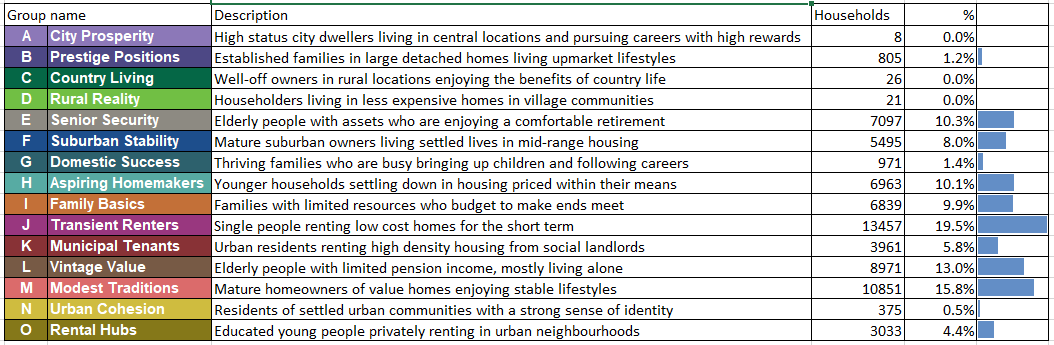
The following are the total count and percentage of households within each high level mosaic group. A large majority of Blackpool households fall into five groups; J, M, L, E and H, representing 68.7% of all households in the town. Groups J (Transient Renters) and M (Modest Traditions) account for 35.3% of Blackpool households, compared to 10.1% across the UK as a whole.
Figure 9: percentage of households in each Mosaic group - Blackpool
 Source: Experian - Mosaic Public Sector 2023
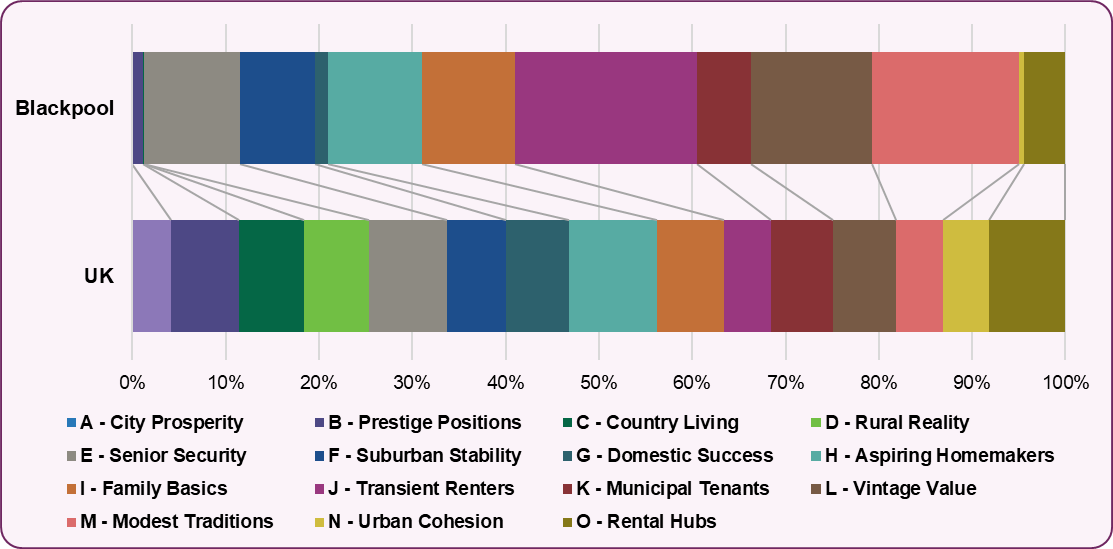
The bar chart below shows how households in each area are categorised. Blackpool has a bias towards J, L and M segments compared to the UK, with higher percentages of households in these groups.
Figure 10: percentage of households in Mosaic groups - comparison of Blackpool and the UK
 Source: Experian - Mosaic Public Sector 2023
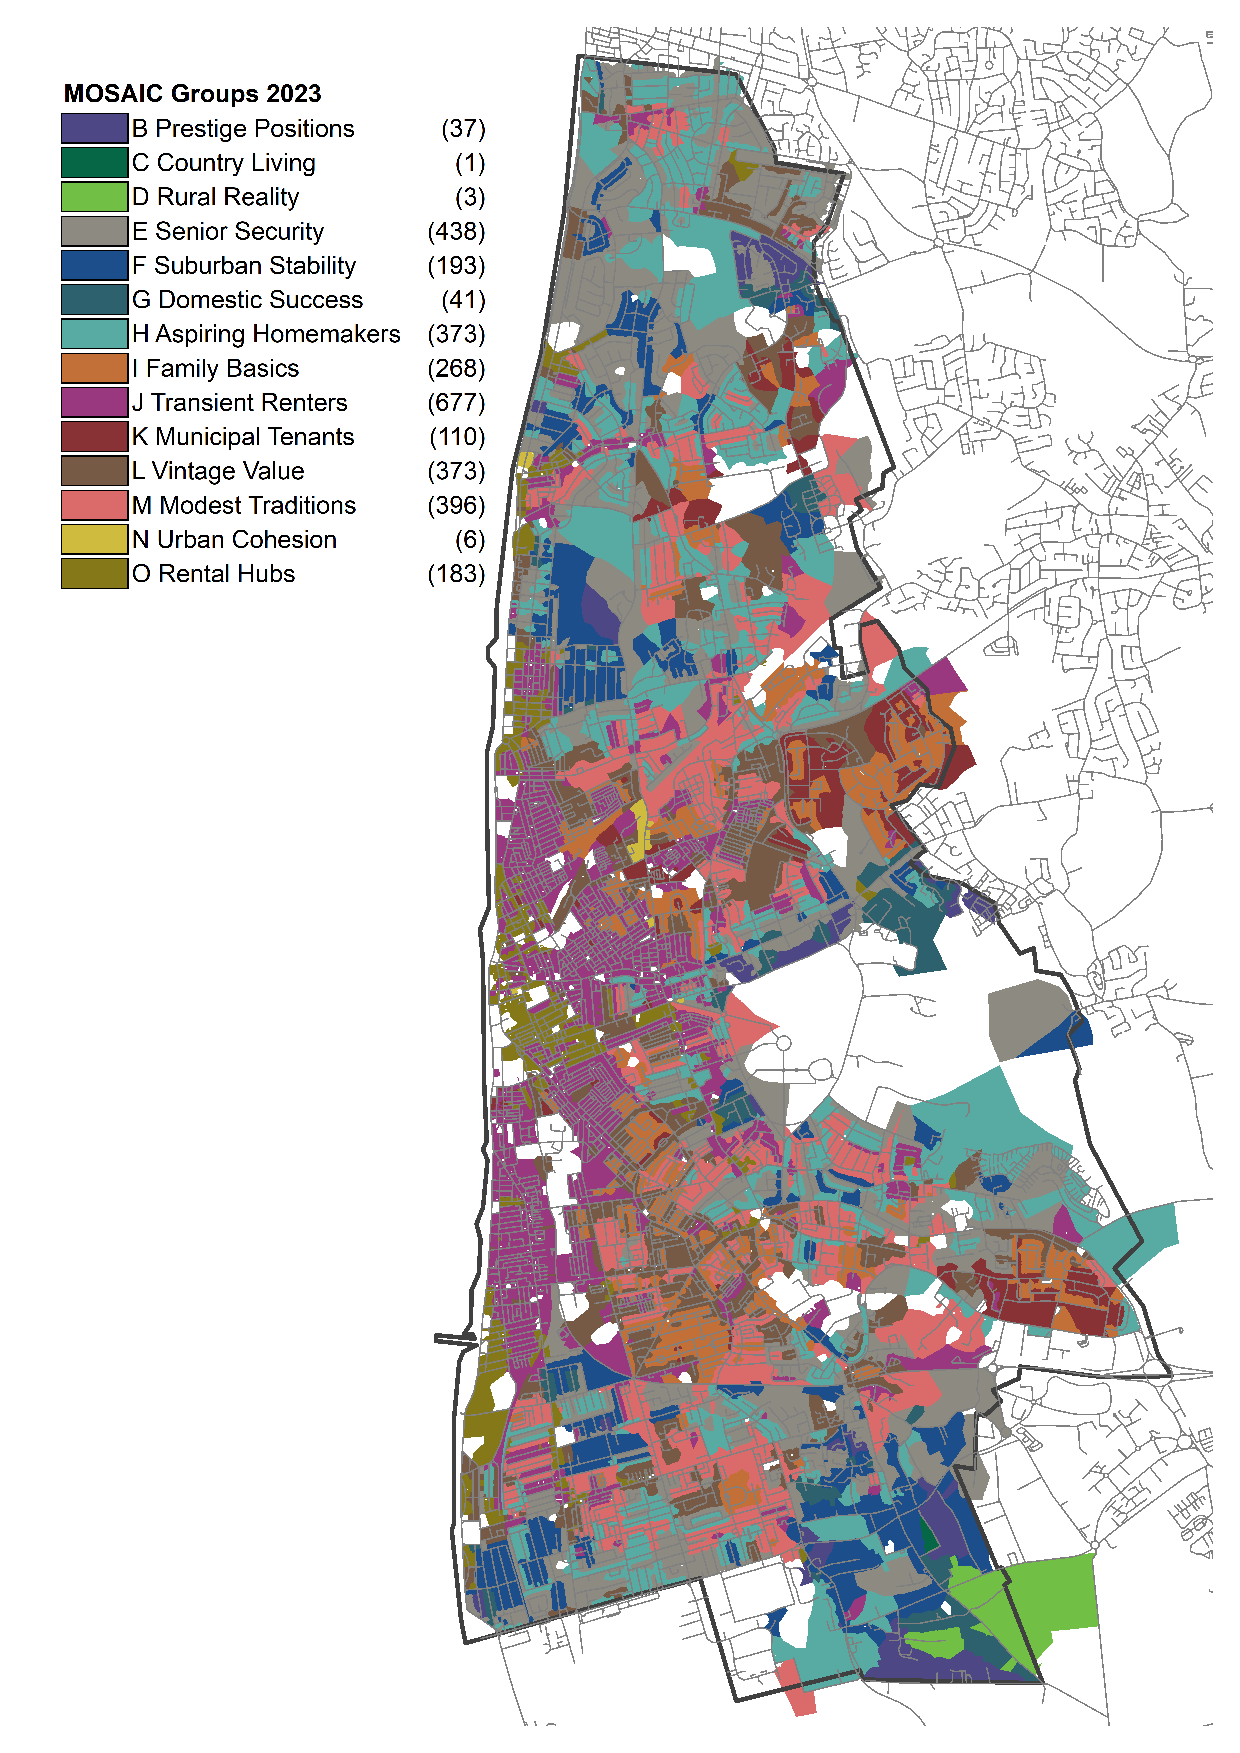
Each Blackpool postcode has been designated a Mosaic group that is most representative of the households it contains. This is visually represented in Figure 11.
Figure 11: map of Mosaic groups in Blackpool
 Source: Experian, Mosaic Public Sector 2023
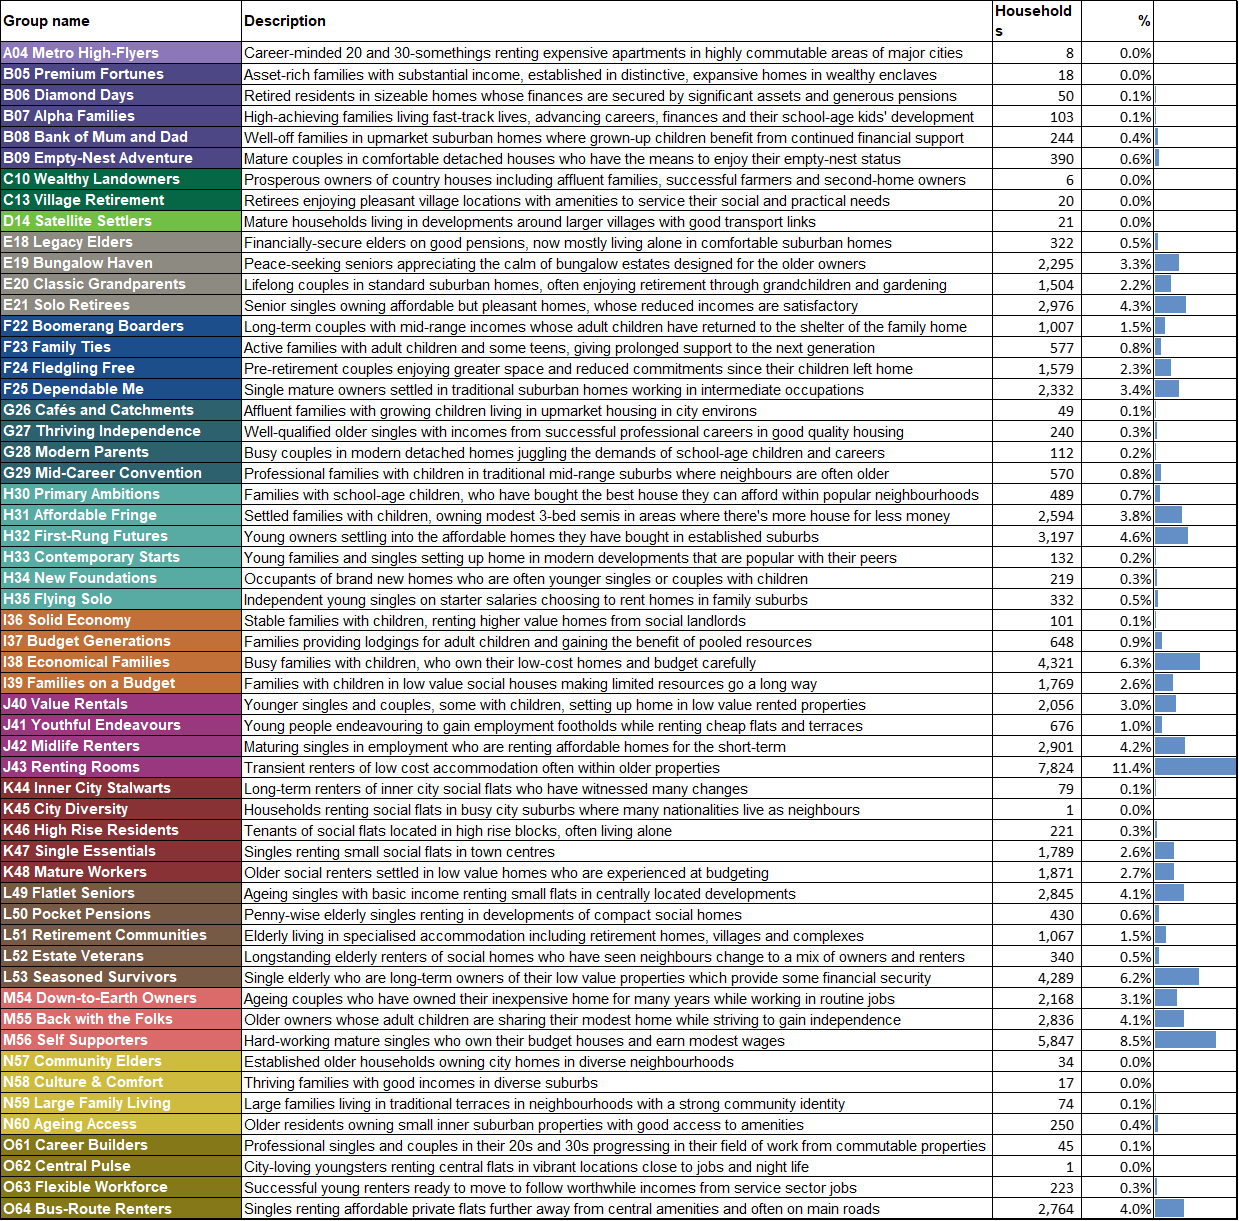
Mosaic further divides groups into 66 types to allow a more in-depth understanding of the geo-demographic makeup of Blackpool residents. Figure 12 displays the mosaic types in Blackpool and the number and proportion of Blackpool households in each.
Figure 12: households by Mosaic type in Blackpool
 Source: Mosaic Public Sector 2023
Figure 13 displays the key attributes for the five biggest Mosaic types in Blackpool which represent 37% of all households.
Figure 13: Top five Mosaic types in Blackpool
J43 Renting Rooms – transient renters of low cost accommodation often within older properties
-
- Singles and homesharers
- Rent terraced houses
- Vocational qualifications
- Low discretionary income
- Mobile calls in home
- Minimum credit card payments
M56 Self Supporters – hard-working mature singles who own their budget houses and earn modest wages
-
- Middle-aged singles
- No children
- Low value, terraced houses
- Low discretionary income
- Access internet from home
- Watch TV
I38 Economical Families – busy families with children, who own their low-cost homes and budget carefully
-
- Families with many children
- Low value terraces
- Low to mid household income
- Internet via smartphone
- Games consoles
L53 Seasoned Survivors – single elderly who are long-term owners of their low value properties which provide some financial security
-
- Retired singles
- Pre-war generation
- No qualifications
- Worked in metals and mining
- Fuel and water poverty
- Solar panels
H32 First-Rung Futures – young owners settling into the affordable homes they have bought in established suburbs
-
- Singles
- Millennials
- University degrees
- High outstanding mortgages
- Internet via smartphone
- Don’t use landlines
Experian, 2023