Religion and Belief
Last Modified 20/03/2023 14:27:35
Share this page
The most reliable indicator of religion and belief of the population at a local and national level is taken from the national Census, last conducted in 2021, and previously in 2011 and 2001. The information regarding religion collected within the Census does not give any indication of an individual's level of religious observance or religious practice; it only asks which group an individual identifies themselves as belonging to.
Stated Religion in Blackpool
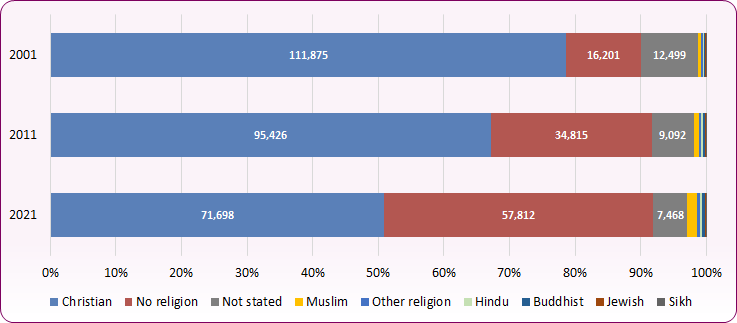
71,698 (51%) Blackpool residents identified themselves as Christian in 2021. This is a decrease from 67% of the population in 2011 and 79% in 2001. Christianity remains by far the most commonly stated religious affiliation, but also the only one that has seen a significant decrease in size since 2001.
The second largest group are those who identify themselves as having no religion. In 2021, 57,812 (41%) of Blackpool residents identified themselves as having no religion, a substantial increase from 34,815 (25%) in 2011 and 16,201 (11%) in 2001. 5% of the population of Blackpool chose not to state their religious belief.
Figure 1 summarises the changes in stated religion among Blackpool residents between 2001 and 2021.
Figure 1 - Change in Stated Religion in Blackpool 2001 to 2021 (number and proportion)
 Source: Office for National Statistics (ONS), Census 2021 (and historic 2011 and 2001 data)
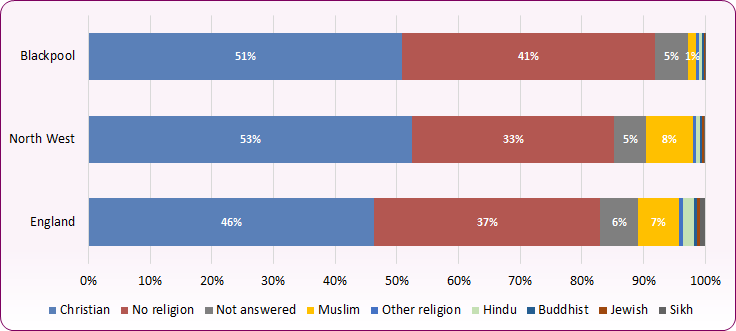
These reductions in those identifying as Christian, and the increases of those identifying as having no religion, are also reflected in England and Wales census data. For the first time in a census, less than half of the England and Wales population (46.2%) described themselves as Christian, a decrease from 59.3% in 2011. The proportion of those identifying as having no religion increased to 37.2% from 25.2% in 2011. Comparisons between Blackpool, England, and the North West are provided in Figure 2.
Figure 2 - Stated Religion in Blackpool, North West, England - Census, 2021
 Source: Office for National Statistics (ONS), Census 2021
Other Religions
As is shown in Figure 2 (above), the proportion of the Blackpool population identifying with a religion other than Christian is considerably lower than both England and the North West. This is likely to be reflective of the relatively low proportion of ethnic minority groups in Blackpool compared to national and regional levels (see JSNA Ethnicity page).
In the 2021 census, 2.9% of Blackpool residents identify themselves as having a religious belief other than Christian. This is an increase from 1.9% of the population in 2011, but is still a very small proportion of the Blackpool population when compared to the religious makeup of the national population, with 11% of the England population identifying with a religion other than Christianity.
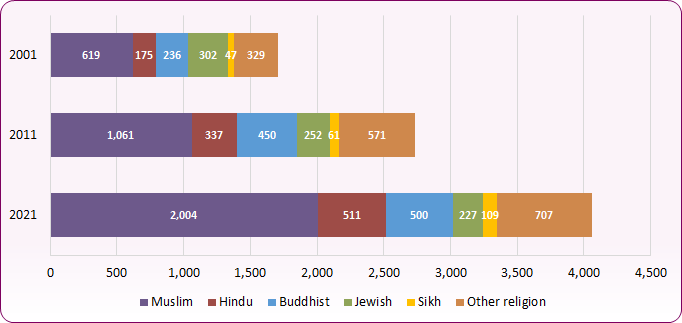
Figure 3 summarises the change in numbers of people stating they have a religious belief other than Christian in Blackpool between 2001 and 2021. The largest increase between 2011 and 2021 in Blackpool residents stating 'other religions' was among those identifying as Muslim, though the overall proportion of Blackpool's Muslim population (1.4%) remains considerably lower than England (6.7%) and the North West (7.6%). Increases were also seen in people identiying their religion as Hindu, Buddhist, Sikh, and 'other religions', while the number of people identifying as Jewish reduced slightly.
Figure 3 - Change in Stated Religion in Blackpool - Other Religions - 2001 to 2021
 Source: Office for National Statistics (ONS), Census 2021 (and historic 2011 and 2001 data)
Ward-level Variations in Stated Religion
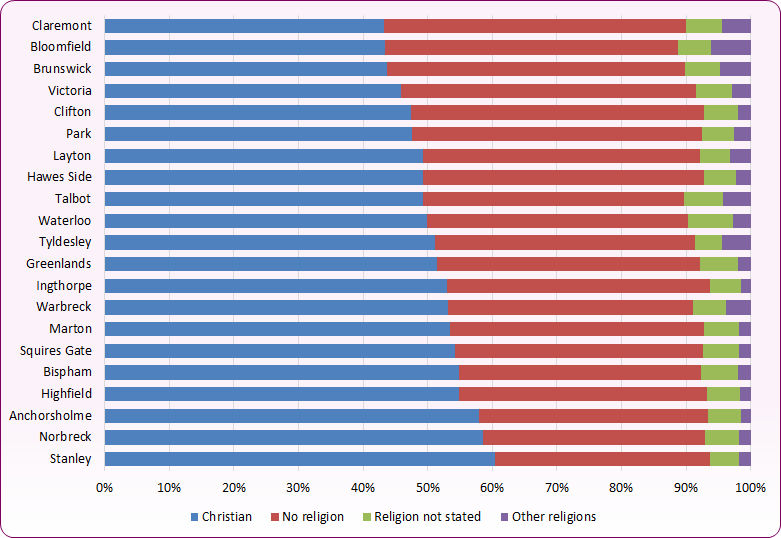
Figure 4 demonstrates the variation in religious belief within Blackpool. Broadly, the population living within those electoral wards with older and less deprived communities are more likely to identify themselves as Christian and the populations living within wards with younger and more deprived communities are more likely to identify themselves as having no religion.
Figure 4 - Religion in Blackpool by Electoral Ward - 2021
 Source: Office for National Statistics (ONS), Census 2021