Census 2021 Population Estimates
Last Modified 09/01/2024 14:27:38
Share this page
Blackpool Census 2021 facts and figures
The Office for National Statistics (ONS) has published a local area webpage for Blackpool, drawn from the Census 2021 and other sources. Maps and local profiles about Blackpool's population, health and the economy can be found at https://www.ons.gov.uk/visualisations/areas/area/?code=E06000009.
Census 2021 population estimates
The England and Wales census has happened every 10 years since 1801, except in 1941. It gives detailed information about the characteristics of all people and households in England and Wales. It is a legal requirement for everyone to be counted in the census and to provide accurate information. The latest census took place 21 March 2021 and was conducted by the ONS. It achieved a response rate of 97% of the usual resident population. This high response rate enables the ONS to generate high quality population estimates.
The first release of Census 2021 population data was in June 2022, with subsequent releases providing more information about national and local populations. This JSNA page will be updated as more detailed population data becomes available.
According to Census 2021, the usual resident population of Blackpool is approximately 141,100. This is a decrease of 0.7% since the last census in 2011, whilst the overall population of England increased by 6.6% and the North West region increased by 5.2%. The population of neighbouring areas of Fylde (+7.4%) and Wyre (+3.9%) also increased over the same period.
Blackpool is the third most densely populated local authority in the North West, with 4,046 people per square kilometre (compared to 4,773 in Manchester, 4,347 in Liverpool, 491 in neighbouring Fylde, and 397 in Wyre).
Estimates indicate that older people (65 years plus) account for a greater proportion of Blackpool's resident population than is observed nationally (figure 1). Since the 2011 census there has been a 7.6% increase in the number of people aged 65 and over in Blackpool, compared to a national increase of 3.6%. The Blackpool population of people aged 15 to 64 years has decreased by 2.8%, compared to a 3.6% increase nationally; and the population of those under 15 years of age has decreased by 2.1% since 2011, compared to an increase of 5% nationally.
Figure 1: 2021 population - males and females, all ages, 0-14 years and 65+
| | Total Population | Males | Females | Age 0-14 years | Age 65 and over |
|---|
| | No. | No. | % | No. | % | No. | % | No. | % |
|---|
| England |
56,489,800 |
27,656,300 |
49% |
28,833,500 |
51% |
9,838,700 |
17.4% |
10,401,200 |
18.4% |
| Blackpool |
141,100 |
69,700 |
49.4% |
71,400 |
50.6% |
23,200 |
16.4% |
29,300 |
20.8% |
| Source: Office for National Statistics, Population and household estimates, England and Wales: Census 2021 (figures rounded to nearest 100) |
Figure 2 gives Blackpool population estimates by males and females and by five-year age group. People aged 50-59 make up 15.2% of Blackpool's population (13.7% nationally). 21.7% of Blackpool's population is aged under 20 (23.1% nationally), and 9.7% are aged 75 and above (8.6% nationally). Overall, there are significantly more people aged over 45 in Blackpool (48.8%) than is seen nationally (44.2%).
There have been some significant changes to the age distribution of the estimated population since the last census in 2011. The 55-59 age group increased by 31% over the period, the 50-54 age group by 9%, and the 30-34 group by 22%; though 40-44 and 45-49 age groups decreased by 22% and 27% respectively. Increases are also seen in the 70-79 age groups, with decreases in all under 25 age groups except the 5-9-years.
Figure 2: Census 2021 population estimates by sex, five year age group and change from 2011 - Blackpool
| Age group | Males | Females | Persons |
|---|
| All ages |
69,700 |
71,400 |
141,100 |
Proportion (%) |
2011 change (%) |
| 0-4 |
3,700 |
3,600 |
7,400 |
5.2% |
-10% |
| 5-9 |
4,000 |
3,900 |
7,900 |
5.6% |
+6% |
| 10-14 |
4,100 |
3,800 |
7,900 |
5.6% |
-2% |
| 15-19 |
3,800 |
3,600 |
7,400 |
5.2% |
-14% |
| 20-24 |
3,700 |
3,700 |
7,400 |
5.2% |
-13% |
| 25-29 |
4,100 |
4,500 |
8,600 |
6.1% |
- |
| 30-34 |
4,600 |
4,900 |
9,500 |
6.7% |
+22% |
| 35-39 |
4,200 |
4,400 |
8,500 |
6.0% |
-1% |
| 40-44 |
3,900 |
3,900 |
7,700 |
5.5% |
-27% |
| 45-49 |
4,300 |
4,300 |
8,600 |
6.1% |
-22% |
| 50-54 |
5,300 |
5,200 |
10,500 |
7.4% |
+9% |
| 55-59 |
5,600 |
5,400 |
11,000 |
7.8% |
+31% |
| 60-64 |
4,800 |
4,600 |
9,400 |
6.7% |
- |
| 65-69 |
3,900 |
3,800 |
7,700 |
5.5% |
- |
| 70-74 |
3,900 |
4,000 |
7,900 |
5.6% |
+19% |
| 75-79 |
2,700 |
3,100 |
5,800 |
4.1% |
+11% |
| 80-84 |
1,800 |
2,300 |
4,200 |
3.0% |
+7% |
| 85-89 |
900 |
1,500 |
2,400 |
1.7% |
-1% |
| 90+ |
400 |
900 |
1,300 |
0.9% |
-1% |
| Source: Office for National Statistics, Population and household estimates, England and Wales: Census 2021. Figures rounded to nearest 100. Figures may not add exactly due to this rounding. |
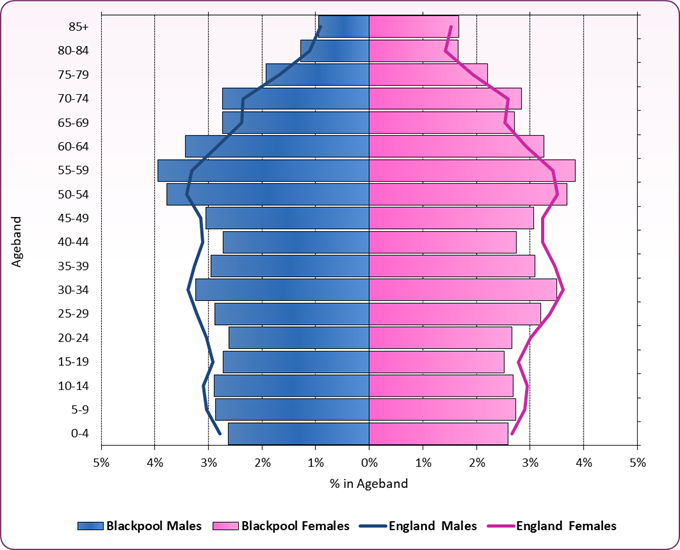
Population pyramid
Blackpool's population pyramid (figure 3) shows the differences across the age groups compared to England, with higher proportions of those aged 50 and over in Blackpool (males and females). There are lower proportions in ages 45 and younger. Blackpool reflects England's higher proportion of females in the older age bands than males.
Figure 3: Census 2021 Population Pyramid - Blackpool and England
 Source: Office for National Statistics, Population and household estimates, England and Wales: Census 2021.
Household composition
Figure 4 and figure 5 show the household composition and household size for Blackpool from the 2021 Census. Blackpool has more single-person housholds compared to North West and England, reflecting the housing stock and population of the area. Almost a quarter (24.8%) of Blackpool's households have dependent children (North West 28%, England 28.5%). Of these, 9% are lone parent households (North West 7.7%, England 6.9%). The interactive map provides further breakdowns.
Figure 5: Household size - Blackpool, North West and England, 2021
| | Blackpool | North West | England |
|---|
| Number of households |
64,367 |
3,009,549 |
22,063,368 |
| One person |
38.0% |
32.2% |
30.1% |
| Two people |
32.4% |
33.5% |
34.2% |
| Three people |
14.5% |
15.7% |
15.6% |
| Four people |
9.9% |
12.2% |
13.0% |
| Five people |
3.6% |
4.3% |
4.7% |
| Six or more people |
1.6% |
2.1% |
2.4% |
| Source: NOMIS - official Census statistics (TS003 - household composition) |