Coronavirus (COVID-19): 2020-2022
Last Modified 31/01/2024 15:39:05
Share this page
Introduction
2020 will undoubtedly be remembered as the year when a novel coronavirus, which causes the disease COVID-19, emerged and spread around the world. Cases of COVID-19 started to be identified in the UK in February 2020 and the first case in a Blackpool resident was identified on 16 March 2020. This report covers the three years of the pandemic to December 2022.
On 31 December 2019, the World Health Organization (WHO) was informed of a cluster of cases of pneumonia of unknown cause detected in Wuhan City, Hubei Province, China. On 12 January 2020, it was announced that a novel coronavirus had been identified in samples obtained from cases and that initial analysis of virus genetic sequences suggested that this was the cause of the outbreak. This virus is referred to as SARS-CoV-2 and the associated disease as COVID-19. The source of the outbreak has yet to be determined. The outbreak is likely to have occurred when the disease transferred from an animal source to humans, but the mechanism by which this occurred has not yet been established. SARS-CoV-2 is primarily transmitted between people through respiratory (droplet and aerosol) and contact routes.
The COVID-19 pandemic led to an unprecedented shock to all aspects of our lives and has had a significant impact on the current health of the UK. It will still be a long time before the full effects are understood given the multiple ways the factors that influence our health have been affected and the disproportionate effects of the pandemic on some groups reflect existing societal fault lines, with the failure to address historical inequalities exacerbating the impact for many.1
Clinical Features
COVID-19 presents with a range of symptoms of varying severity. An estimated 1 in 3 people have COVID-19 without displaying symptoms. More common symptoms are: fever, a new and continuous cough, anosmia (loss of smell) and/or ageusia (loss of taste). Examples of other symptoms include shortness of breath, fatigue, loss of appetite, myalgia (muscle ache), sore throat, headache, nasal congestion (stuffy nose), runny nose, diarrhoea, nausea and vomiting.
COVID-19 cases
The first two cases of COVID-19 identified within the UK were confirmed on 31 January 2020 in York. In total 23 cases were identified in the UK in the period to 29 February and rapid exponential growth of COVID-19 infection occurred through early March. The first case of COVID-19 in a Blackpool resident was identified on 10 March. Testing for COVID-19 served two purposes; it allowed the diagnosis of an individual, but also allowed us to track the progress of the epidemic. By late-March 2020 it was clear that testing capacity had been exceeded and the vast majority of people experiencing symptoms consistent with COVID-19 were not able to access testing. This was an extremely important consideration when assessing the impact of COVID-19 in the early period, March to May 2020.
Figure 1 shows the trend in cases in Blackpool residents and figure 2 shows the trend for England as a whole. The number of cases were very low in both charts in the March to May 2020 period. However, we can be confident that this was not a true reflection of the spread of infection, as the peak in both hospital admissions (figure 3) and deaths (figure 4) in April 2020 were nearly as high as the peak in January 2021.
The shape of the epidemic curve in the first wave of infections in Blackpool was slightly different to what we saw across England as a whole. Cases peaked in Blackpool residents in late October 2020, with a lesser peak in January 2021. This is quite different to England as a whole, where the January 2021 peak is two and a half times greater than seen in October 2020. Cases remained at a fairly consistent level through summer and autumn of 2021 until exponential growth in winter saw cases peak in early January, which was a similar picture to England.
Throughout the period from September 2020 to March 2022, the testing rate, per head of Blackpool population, remained consistently and significantly higher than the North West as a whole and Blackpool’s neighbouring areas. This is both evidence of the excellent accessibility of testing in Blackpool, but also gives confidence that the information available to monitor the progress of the epidemic in Blackpool was of a high standard.
Across Blackpool:
-
- There had been 47,569 confirmed cases of COVID-19 by the 31 March 2022
- A further 7,274 cases were confirmed up to the end of that year though this will have been mainly through health and social care settings as free testing for the public ended on 1 April
- The number of cases peaked in early January 2022 with 898 cases in one day
- Over the three year period, 17.7% of cases were aged over 60 years, compared to 15.4% across England.
Figure 1: Number of cases by specimen date: Blackpool
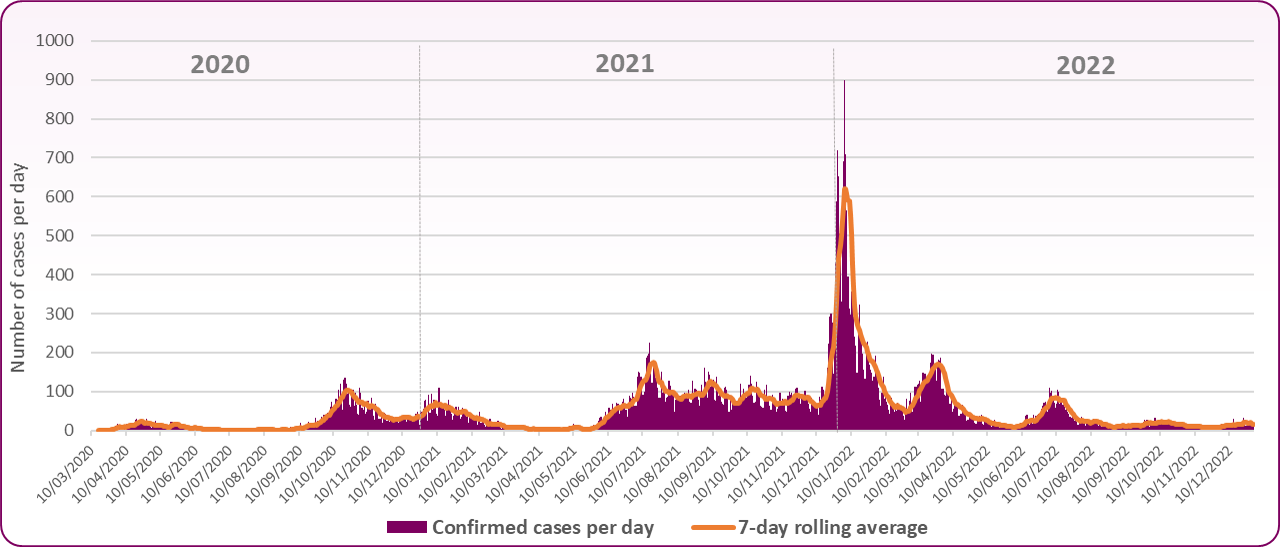 Source: Coronavirus (COVID-19) in the UK https://coronavirus.data.gov.uk/
Figure 2: Number of cases by specimen date: England
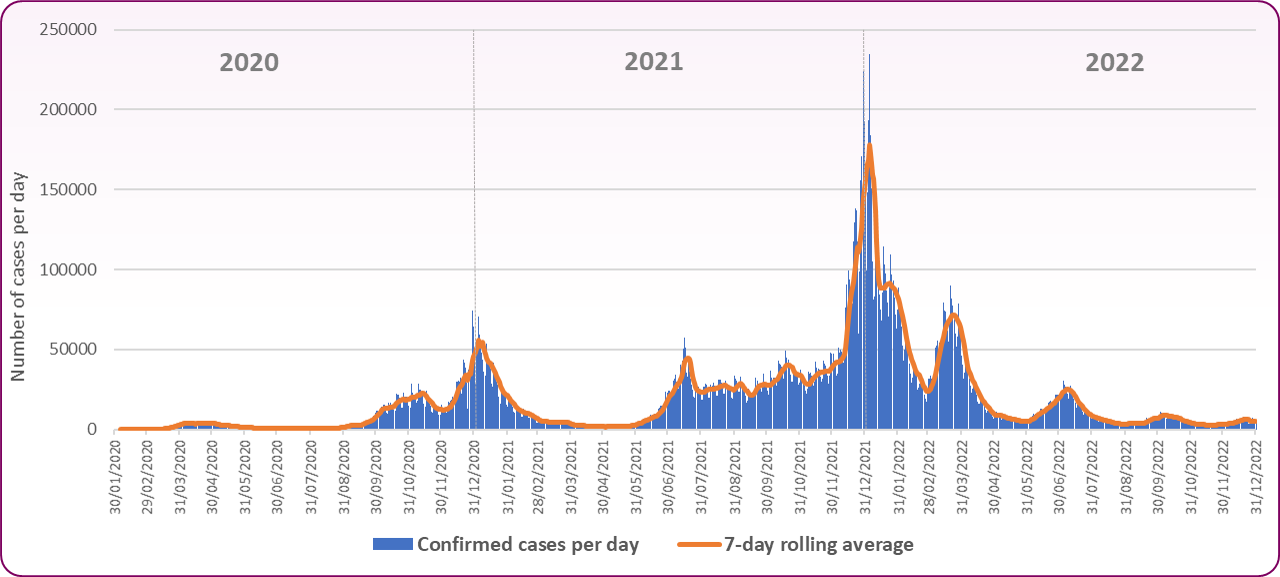 Source: Coronavirus (COVID-19) in the UK https://coronavirus.data.gov.uk/
The ongoing success of the vaccination programme, increased access to treatments and higher immunity amongst the population allowed the government to scale back testing in England. Free testing for the public ended on 1 April 2022 as part of the government’s Living with COVID-19 plan, but asymptomatic testing continued to be used in some settings during periods of high case rates. Regular asymptomatic testing was paused from the 31 August 2022 as cases continued to fall though symptomatic testing continued within healthcare and social care. From April 2023 onwards, testing will be only provided to individuals and settings at highest risk from COVID-19, whilst continuing to support diagnosis for care and access to treatments.
Healthcare
The onset of the COVID-19 pandemic in March 2020 had a significant impact on secondary care service providers across the NHS. All but the most urgent elective activity was stood down to allow Trusts to focus on their response to the pandemic, including the preparation and management of emergency admissions. Telephone and video appointments were utilised wherever possible to limit face-to-face clinic appointments and wards and departments were reconfigured to accommodate the huge surge in positive patients. Staff with key skills were also trained and redeployed to areas such as critical care in order to meet the needs of the local population.
By June 2020, the first wave had ended and new national guidance was issued which aimed to allow some secondary care services to resume as long as certain infection prevention measures were implemented. This included the need for elective patients to self-isolate and to have a negative test prior to admission. New patient pathways were introduced in line with this guidance and all patients admitted to the Trust were tested for COVID-19 on admission and again at regular intervals thereafter.
Secondary care services were put under pressure once again during the second wave of the pandemic in October 2020, when hospital admissions, including critical care admissions, surpassed those recorded during the first wave. This exponential increase in cases is clearly demonstrated in figure 3 below as is the significant decrease over the following weeks. Nosocomial (hospital acquired) infections and outbreaks were also reported throughout the pandemic and the Trust implemented numerous preventative strategies based on the learning from root cause analysis and outbreak investigations.
-
- At the peak of the first wave in April 2020, 144 hospital beds in Blackpool Teaching Hospitals were occupied by patients with COVID-19 and over 100 new cases were reported in a one week period
- The number of beds occupied by patients with COVID-19 reached a peak of 205 on 25 October 2020 with a further peak of 150 in early January 2021
- Smaller peaks continued throughout 2021 and 2022 (figure 3)
- Routine testing ceased in April 2023 and the number of cases in hospital is no longer reported in the same way.
Figure 3: Daily count of confirmed COVID-19 patients in hospital: Blackpool Teaching Hospitals NHS Foundation Trust
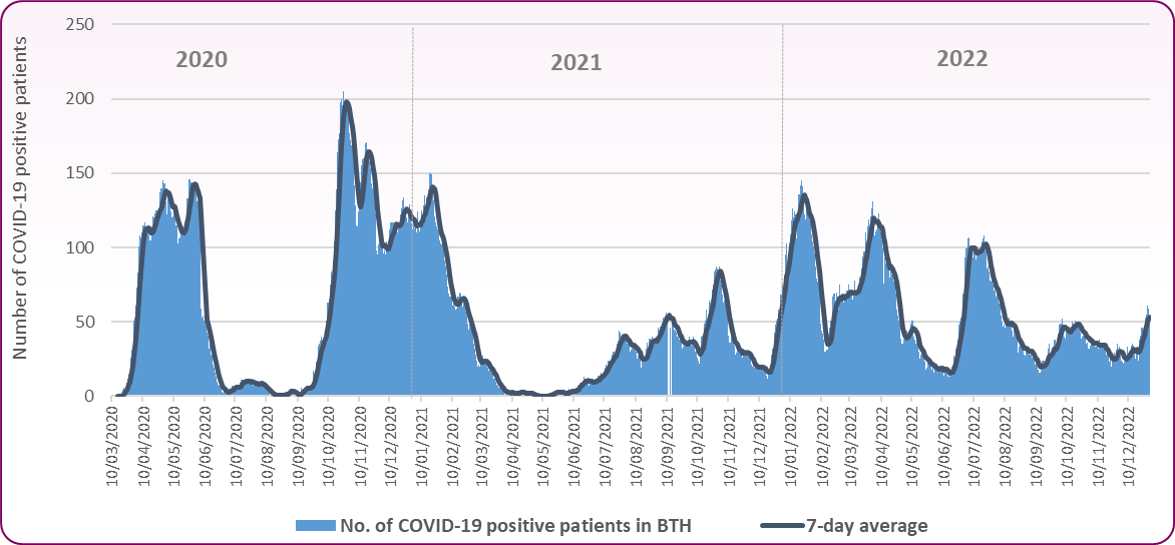 Source: Coronavirus (COVID-19) in the UK https://coronavirus.data.gov.uk/
Mortality
COVID-19 was the leading cause of death in England in 2020, but the pandemic had a much greater impact on mortality in some areas than others.
Since the beginning of the pandemic in February 2020 to the end of December 2022, there have been 177,254 deaths within 28 days of a positive COVID-19 result and 183,243 deaths with COVID-19 on the death certificate across England. There are several risk factors for a fatal outcome associated with coronavirus including: chronic comorbidities, underlying respiratory conditions, older age population, diabetes, hypertension and obesity. The risk of death is also higher for disabled people.2
Across Blackpool:
-
- There have been 723 deaths within 28 days of a positive COVID-19 result and 653 deaths with COVID-19 on the death certificate over the three year period.
- COVID-19 accounted for one in nine deaths (10.9%) in Blackpool in the three year period. However, among all deaths which occurred between April 2020 (first death from COVID-19) and the end of 2021, the percentage of deaths from COVID-19 was 15.2% or one in seven deaths.
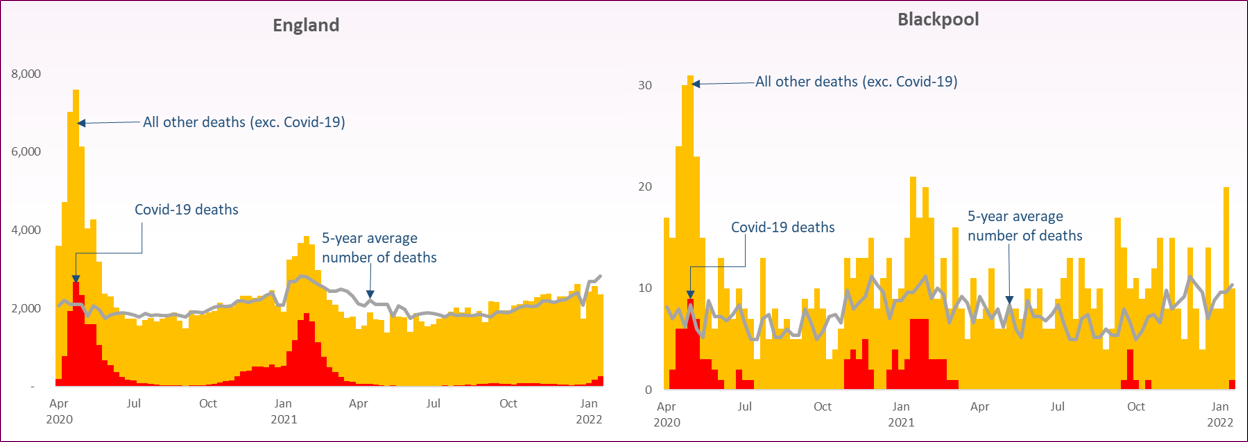
The trend of when deaths occurred in Blackpool residents is shown in figure 4. The red bars show the deaths identified as COVID-19 on death certificates. The number of deaths quickly came to a peak in mid-April 2020 with a slower fall over summer before increasing again from mid-October and falling through March 2021. The later wave of infections saw fewer deaths than previously due to the vaccination programme. The black line allows a comparison of the total number of deaths recorded each week with the average number we have seen in the last five years. This gap between the current number of deaths and what we would expect based on the pattern from previous years is often described as the number of ‘excess deaths’. The number of deaths generally continues to be greater than the 5 year average though deaths with COVID-19 recorded are far fewer than in the early waves of the pandemic.
Figure 4: Trend in number of deaths by week of occurrence in Blackpool, COVID-19 deaths and non-COVID-19 deaths: 2020-2022
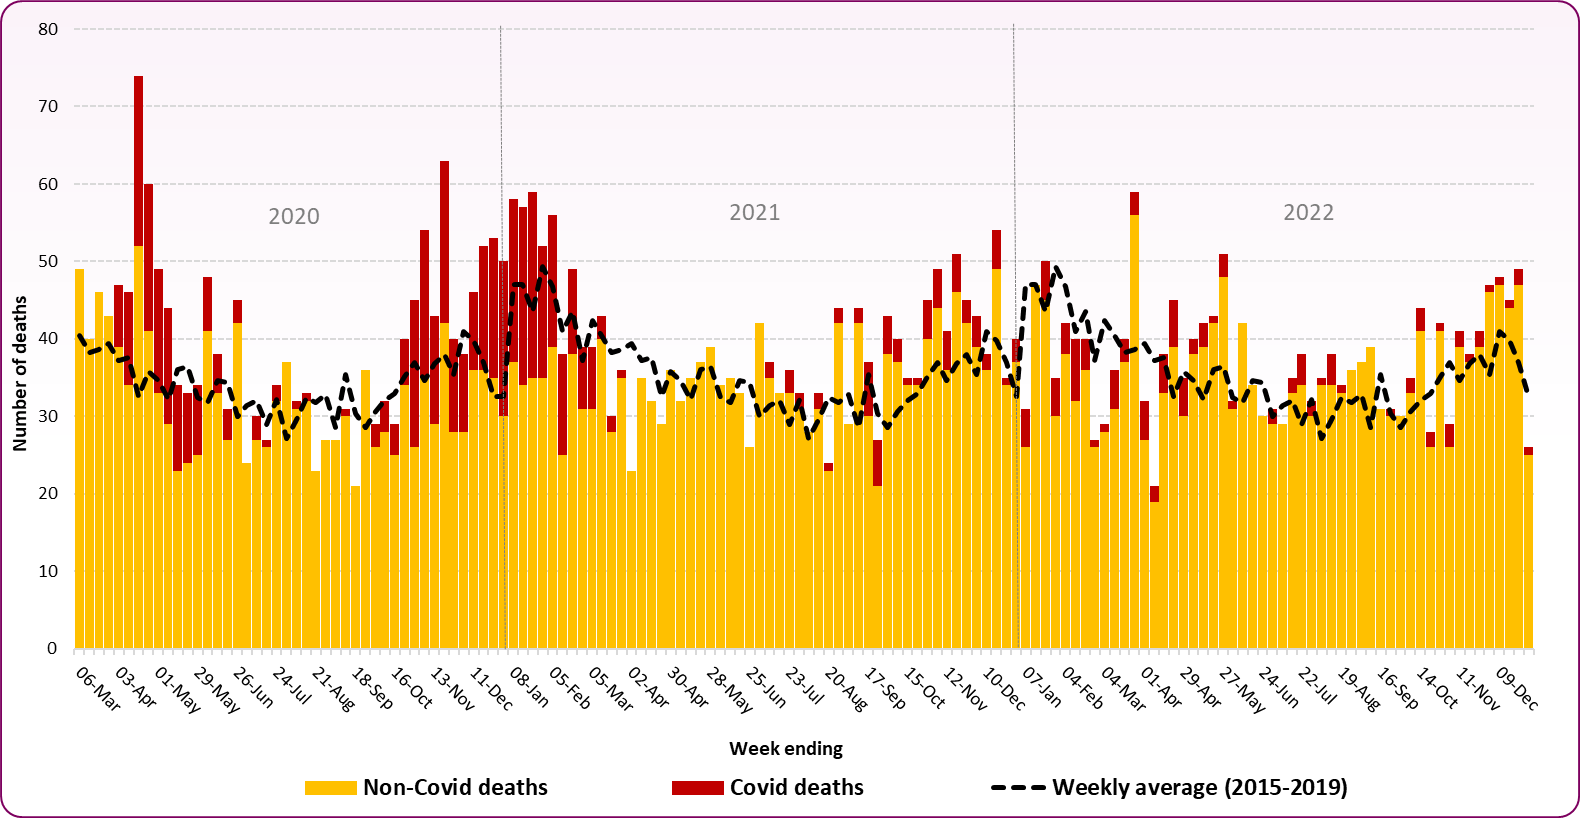 Source: ONS, Death registrations and occurrences by local authority
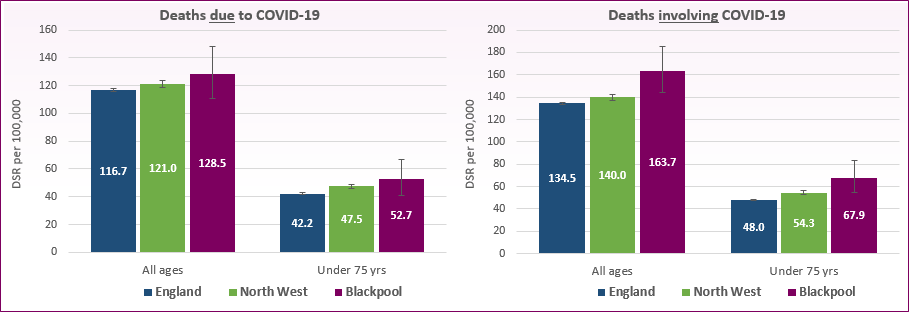
Comparing the numbers of deaths in different areas is more meaningful if we take account of their population sizes and their age and sex distributions. This is particularly important for COVID-19, as we know that it disproportionately impacts older people and to some extent males.
Figure 5 takes these factors into account and shows 20213 death rates for all ages and for those aged under 75 years where COVID-19 was the underlying cause of death (deaths due to COVID-19) and deaths where COVID-19 was mentioned somewhere on the death certificate (deaths involving COVID-19).
-
- Rates of death due to COVID-19 in Blackpool are similar to national averages
- For all ages, the Blackpool rate is 128.5 per 100,000 population compared to 116.7 across England. For those aged under 75 years the Blackpool rate is 52.7 per 100,000 compared to 42.2
- However rates of death involving COVID-19 are significantly higher than the national average. This may be due to the higher than average underlying comorbidities in Blackpool’s population which is known to increase the risk of death.
- For all ages the death rate involving COVID-19 is 163.7 per 100,000 in Blackpool compared to 134.5 in England. At age under 75 years Blackpool’s death rate is 67.9 per 100,000, England is 48.0.
Figure 5: Standardised mortality rates for deaths due to COVID-19 and deaths involving COVID-19, all ages and age under 75 years: 2021
 Source: OHID, Mortality Profile, COVID-19 mortality
Deaths in care home residents
The term "care home resident" refers to all deaths where either (a) the death occurred in a care home or (b) the death occurred elsewhere but the place of residence of the deceased was recorded as a care home. The figures should not be confused with "deaths in care homes" as reported elsewhere, which refers only to category (a). Deaths reported are where COVID-19 is the underlying causes only and do not include those COVID-19 deaths mentioned elsewhere on the death certificate.
More Blackpool care home residents died from COVID-19 in the second wave of the pandemic than in the first and this followed the national picture (figure 6). While the rise in coronavirus deaths among care home residents was much sharper during the first wave between March and September 2020, the number and proportion of deaths were higher in the second wave from September 2020 to April 2021. However, it should be remembered that because of subsequent enhanced testing and increased medical knowledge, there may have been other undiagnosed deaths during the first wave.
Across Blackpool during the period March 2020 to January 2022:
-
- There have been 111 deaths where COVID-19 is the underlying cause in Blackpool care home residents, just under a quarter (24%) of all deaths from COVID-19
- In wave 1 (mid-March to 11 Sept 2020) there were 43 deaths from COVID-19 in care home residents, 14% of all care home resident deaths
- In the second wave (12 Sept 2020 to 2 April 2021) there were 60 deaths, 19% of care home resident deaths
- By comparison, England had 20% of deaths from COVID-19 in care home residents in the first wave and 23% in the second wave
- In the first wave Blackpool had significantly lower proportions of deaths in care home residents than was seen nationally, though it should be remembered that there may have been undiagnosed cases of the virus in the early stages.
- Blackpool's rate in the second wave was not significantly higher than average.
Following the national picture, there were more total deaths of care home residents above the five-year average in wave 1 (134 excess deaths) than in wave 2 (74 excess deaths) though not all such deaths would be because of COVID-19. Other causes include delayed access to healthcare while the lower number in wave 2 may be attributable to vaccine availability and mortality displacement.
Figure 6: Trend in number of deaths to Care Home residents by week of registration, COVID-19 deaths and non-COVID-19 deaths: March 2020 to January 2022
 Source: ONS, Deaths involving COVID-19 in the care sector, England and Wales, Feb 2022 and Blackpool Public Health, Primary Care Mortality Database
COVID-19 vaccination
For details around the COVID-19 vaccination programme, please see the adult vaccination page.
The Health Foundation, The continuing impact of COVID-19 on health and inequalities, August 2022
ONS, Updated estimates of coronavirus (COVID-19) related deaths by disability status, England, May 2022
Following Census 2021, the Office for National Statistics (ONS) is carrying out reconciliation and rebasing of the mid-year population estimates it produces. The official population estimates for mid-2012 to mid-2020 will be revised, to incorporate the data now available from Census 2021. As such, this indicator is currently only presenting data for 2021. Once revised populations for mid-2012 to mid-2020 are published, the back series for this indicator will be published.
UKHSA, The Green Book COVID-19: the green book, chapter 14a, April 2023
HM Government, COVID-19 Response: Living with COVID-19, February 2022