Childhood obesity
Last Modified 30/01/2026 08:50:41
Share this page
Introduction
The global burden and threat of obesity constitutes a major public health challenge that undermines social and economic development throughout the world. Obesity has now reached epidemic proportions and it is estimated that by 2030 over one billion adults globally will be obese. The World Health Organization (WHO) regards childhood obesity as one of the most serious global public health challenges for the 21st century and ending childhood obesity is one of the most complex health challenges facing the international community during this century.1
Tackling obesity is one of the greatest long-term health challenges currently faced in England. Almost two-thirds (65%) of adults are above a healthy weight, and of these half (33%) are living with obesity (2023/24). In England 1 in 3 children leaving primary school are overweight (including obesity), with approximately 1 in 4 living with obesity (2024/25).
Obesity prevalence is highest among the most deprived groups in society. Children resident in the most deprived parts of the country are more than twice as likely to be living with obesity than those in the least deprived areas. Obesity is associated with reduced life expectancy and a range of health conditions including type 2 diabetes, cardiovascular disease, liver and respiratory disease and cancer. Obesity can also have an impact on mental health.2
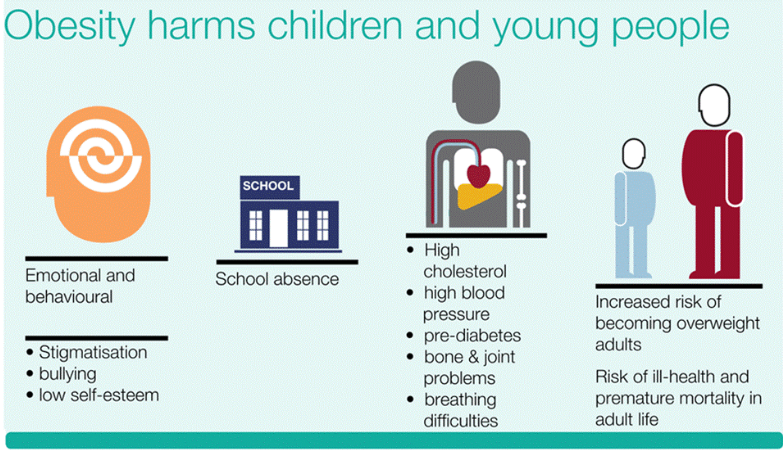 Source: OHID, Childhood obesity: applying All Our Health, April 2022
Obesity is a consequence of poor diet and a lack of physical activity. Unlike most adults, many children and young people cannot choose the environment in which they live or the food they eat. They also may not understand the long-term consequences of their behaviour. They therefore warrant special attention in national and local strategies and plans to tackle the obesity epidemic.
The National Child Measurement Programme (NCMP) is an important element of the Government’s work programme on child obesity. Blackpool Council has a legal responsibility to undertake the NCMP. Every year children in reception (aged 4-5 years) and year 6 (aged 10-11 years) have their height and weight measured to gather population-level surveillance data to allow analysis of trends in growth patterns and monitoring of weight (including levels of overweight and obesity). The data are also used to inform local planning and delivery of services for children.
The impact of obesity is also discussed in the sections on adult obesity, healthy eating, diabetes and physical activity.
Facts, figures and trends
Please note: The National Child Measurement Programme (NCMP) was affected by the impact of Covid-19 over the 2019/20 and 2020/21 academic years. Due to school closures and disrupted learning, the NCMP did not commence at the start of the 2020/21 school year and a decision was made to collect a nationally representative sample of 10%. Some local authorities (including Blackpool) did collect a full dataset and their results are available. From the 2022 to 2023 NCMP onwards data collection was unaffected by issues linked to the COVID-19 pandemic.
In 2024/25, NCMP data for England reported that 13.0% of reception children were overweight, and a further 10.5% were obese. Of these 2.9% were severely obese. For children in year 6, 13.9% were overweight and a further 22.2% obese, of which 5.6% were severely obese.
Following significant increases in excess weight during 2020/21 (the first year of the pandemic) rates of overweight and obesity have fallen back in line with overall trends both nationally and locally.
The NCMP data collected from Blackpool primary schools in 2024/25, reported by NHS Digital, shows:
-
-
- 3,135 valid measurements were received for children with postcodes in the Blackpool area (all figures are rounded).
Reception (2024/25):
- 190 (13.7%) reception children were classed as obese; this is a small increase from 13.2% in 2023/24. It is higher than the trend seen pre-pandemic (with the highest rate in 2020/21 of 18.9%)
- This prevalence rate is significantly higher than the England average of 10.5%
- 415 (30.0%) of the children measured were either overweight or obese (excess weight). This is higher than 2023/24 (27.4%)
- The prevalence of excess weight is significantly higher than the national average of 23.5%. Again, this is higher than the trend pre-pandemic, with 2020/21 having the highest proportion (36.7%)
Year 6 (2024/25):
- 455 children were obese, a prevalence rate of 28.3%, higher than last year’s rate of 26.2%
- It is significantly higher than the national average of 22.2%
- 700 (43.5%) of the children measured were either overweight or obese an increase from the previous year's figure (41.7%)
- Excess weight prevalence is significantly higher than the national average of 36.2%
- Proportions of overweight (including obesity) and obesity-only are higher than the pre-pandemic levels.
Figure 1 and figure 2 show how the proportion of children who are obese in Blackpool more than doubles between reception age and year 6 from 13.7% to 28.3%.
-
-
- The proportion who are overweight in Blackpool is similar in reception and year 6, likely to be accounted for by the large shift towards obesity (and conversely the decreasing proportion who are a healthy weight in year 6).
- Severe obesity in Blackpool is significantly higher than the national average at reception and at year 6, almost doubling from 4.3% in reception to 8.1% in year 6.
Figure 1: weight classification of reception (age 4-5 years) children in Blackpool and England: 2024/25 (%)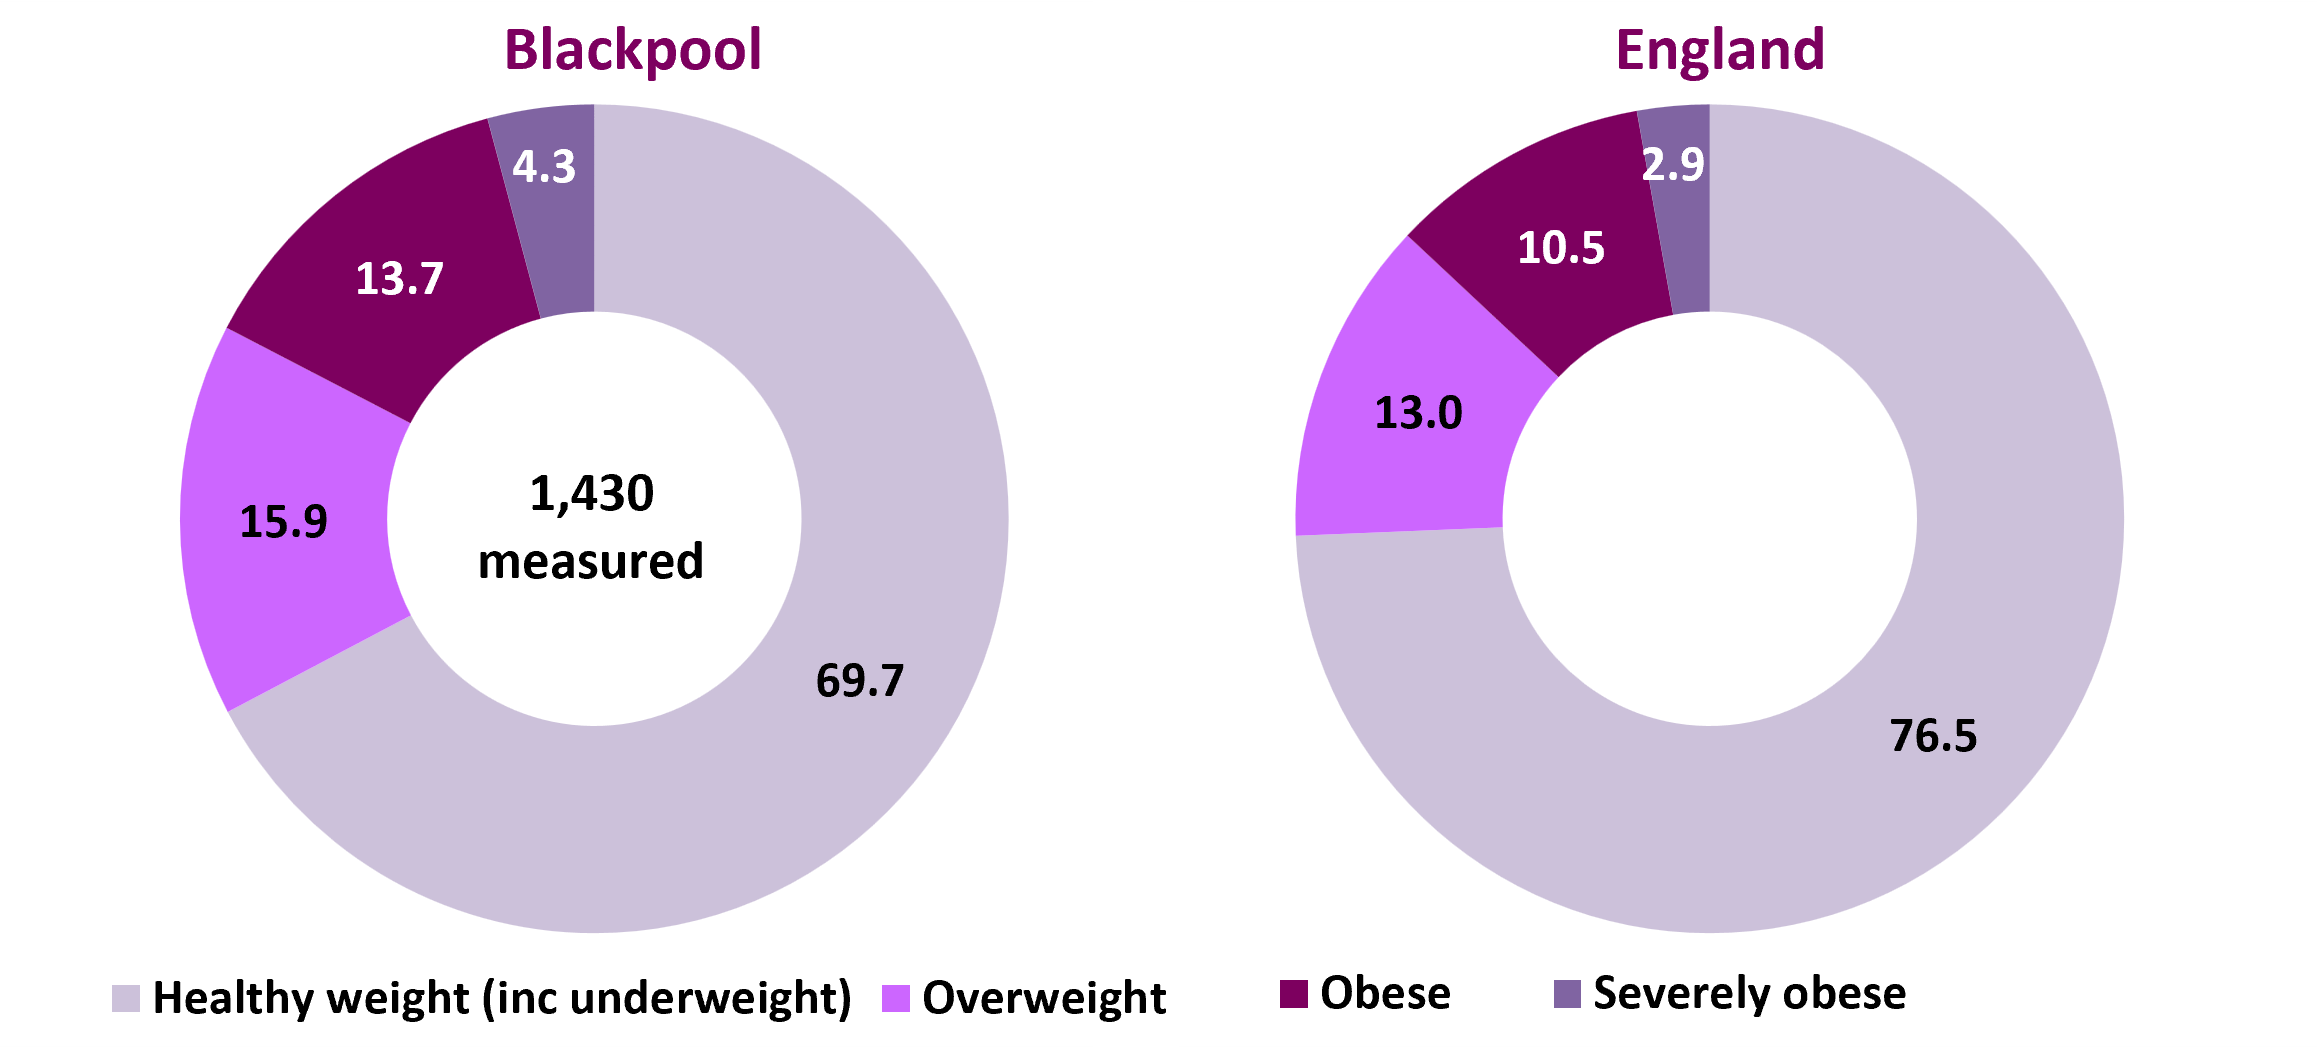
Source: OHID, Fingertips, Obesity Profile (area of residence of child)
Figure 2: weight classification of year 6 age (10-11 years) children in Blackpool and England: 2024/25 (%)
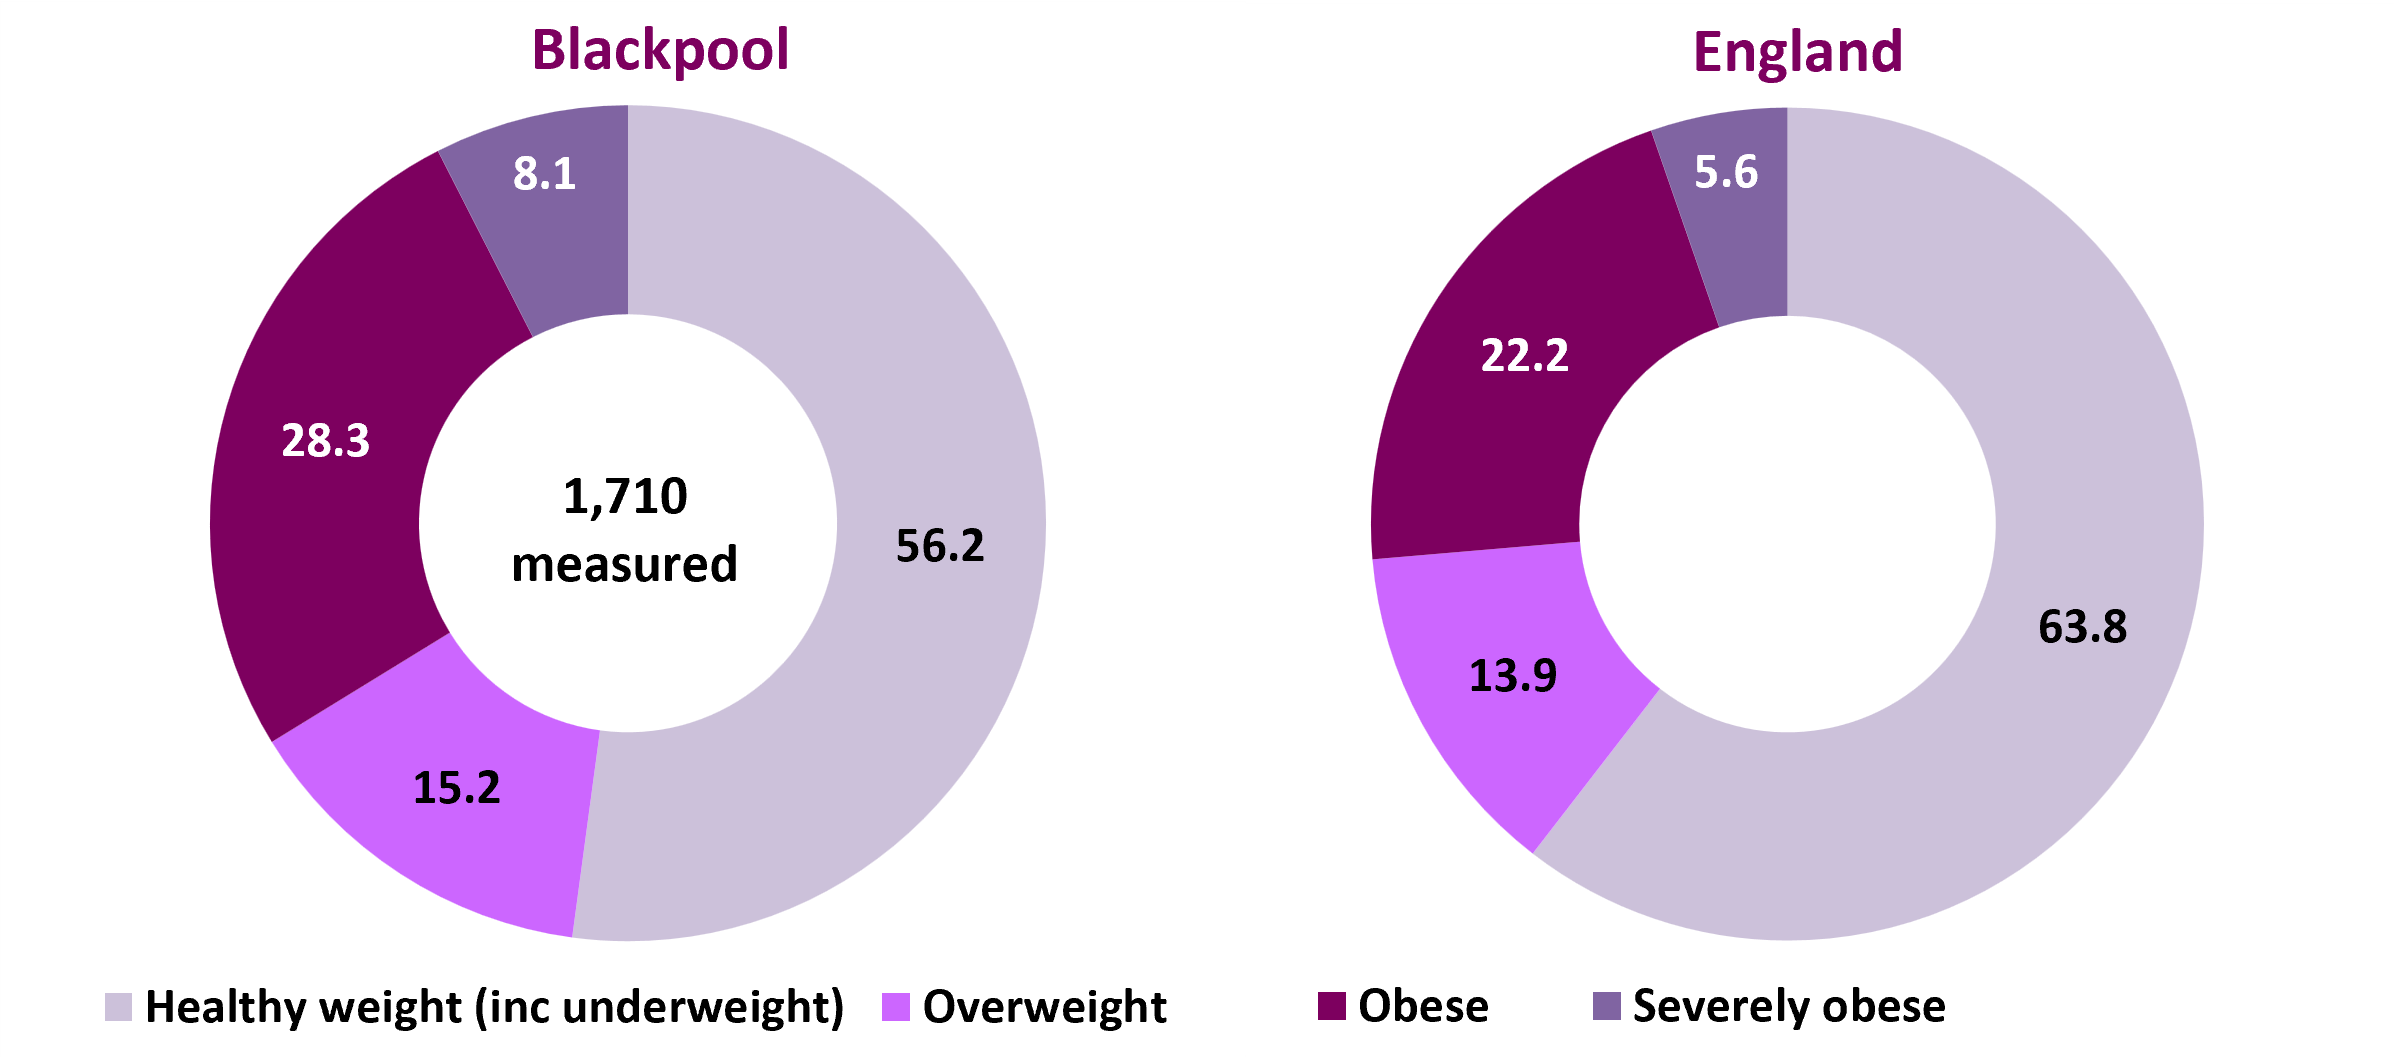
Source: OHID, Fingertips, Obesity Profile (area of residence of child)
Figure 3: prevalence of underweight, healthy weight, overweight, obese and severely obese children, 2023/24, England, North West and Blackpool
| | Underweight | Healthy weight | Overweight | Obese (inc. severely obese) | Severely obese | Excess weight (overweight and obese) | Number measured |
|---|
| Reception |
|---|
| England |
% |
1.1 |
75.4 |
13.0 |
10.5 |
2.6 |
23.5 |
545,589 |
| North West |
% |
0.9 |
74.1 |
13.5 |
11.5 |
2.8 |
25.0 |
73,975 |
| |
Blackpool |
% |
Value suppressed |
69.7 |
15.9 |
13.7 |
3.8 |
30.0 |
1,430 |
| No. |
0 |
965 |
220 |
190 |
55 |
415 |
| Year 6 |
|---|
| England |
% |
1.6 |
62.2 |
13.9 |
22.2 |
5.6 |
35.8 |
600,304 |
| North West |
% |
1.4 |
60.6 |
14.3 |
23.6 |
6.2 |
37.2 |
83,135 |
| |
Blackpool |
% |
1.2 |
55.0 |
15.2 |
28.3 |
8.1 |
41.7 |
1,710 |
| No. |
30 |
885 |
245 |
455 |
130 |
630 |
| Source: OHID, Fingertips, Obesity Profile (area of residence of child). Numbers are rounded to the nearest five. |
Further analysis has found that, nationally and regionally, the prevalence of obesity was higher among boys than girls in both age groups and a higher percentage of girls were of healthy weight than boys. As in previous years there was a strong relationship between deprivation and obesity in both age groups; the gap between obesity prevalence for the most and least deprived areas remains similar over time in both school years.3
Changes in children's body mass index between 2006/07 and 2024/25
Year-to-year variation around the prevalence figures do exist and changes from one year to the next are not always indicative of the long-term trend.
Figure 4 shows the trend over time in the prevalence of excess weight (overweight and obese combined) by year of measurement and school age (reception and year 6). There is clearly an upward trend in excess weight in school children in Blackpool and this is more evident in the older year 6 age group, where the proportion of pupils who were overweight or obese increased from 28% in 2006/07 to 46.8% in 2020/21 (first year of the pandemic). Although there have been decreases in the three years after 2020/21, the latest time period (2024/25) shows an increase in excess weight for both age groups. Proportions remain higher than the pre-pandemic trends for both reception and year 6 children.
For reception age children, the proportions overweight or obese have risen more slowly, ranging from from 22.5% in 2007/08 to the high of 36.7% in 2020/21. The reception rate fell in the three years following 2020/21 however the gap between England and Blackpool has increased since 2021/22. Initially, the trend and rates in both age groups were generally in line with national averages until 2011/12 when the Blackpool trend began to rise and the gap between Blackpool and England began to increase. With the exception of 2016/17, when the year 6 proportion was the same as England (34.2%).
Each coloured point highlighted on the trend lines (figure 4) represents the same cohort of children in Blackpool who have moved through the school years since the NCMP began. Therefore the children measured in reception in 2006/07 were the same cohort of children who were measured in year 6 in 2012/13, up to and including the children in reception in 2018/19 becoming the year 6 cohort in 2024/25 (green dots). There is generally a large increase in excess weight between reception and year 6 children, and in Blackpool the proportion who are overweight and obese has increased by 15% percentage points (between the 2018/19 reception cohort becoming the 2024/25 year 6 cohort).
Figure 4: trend in excess weight prevalence for reception and year 6 showing a cohort comparison, 2006/07 to 2024/25, Blackpool compared to England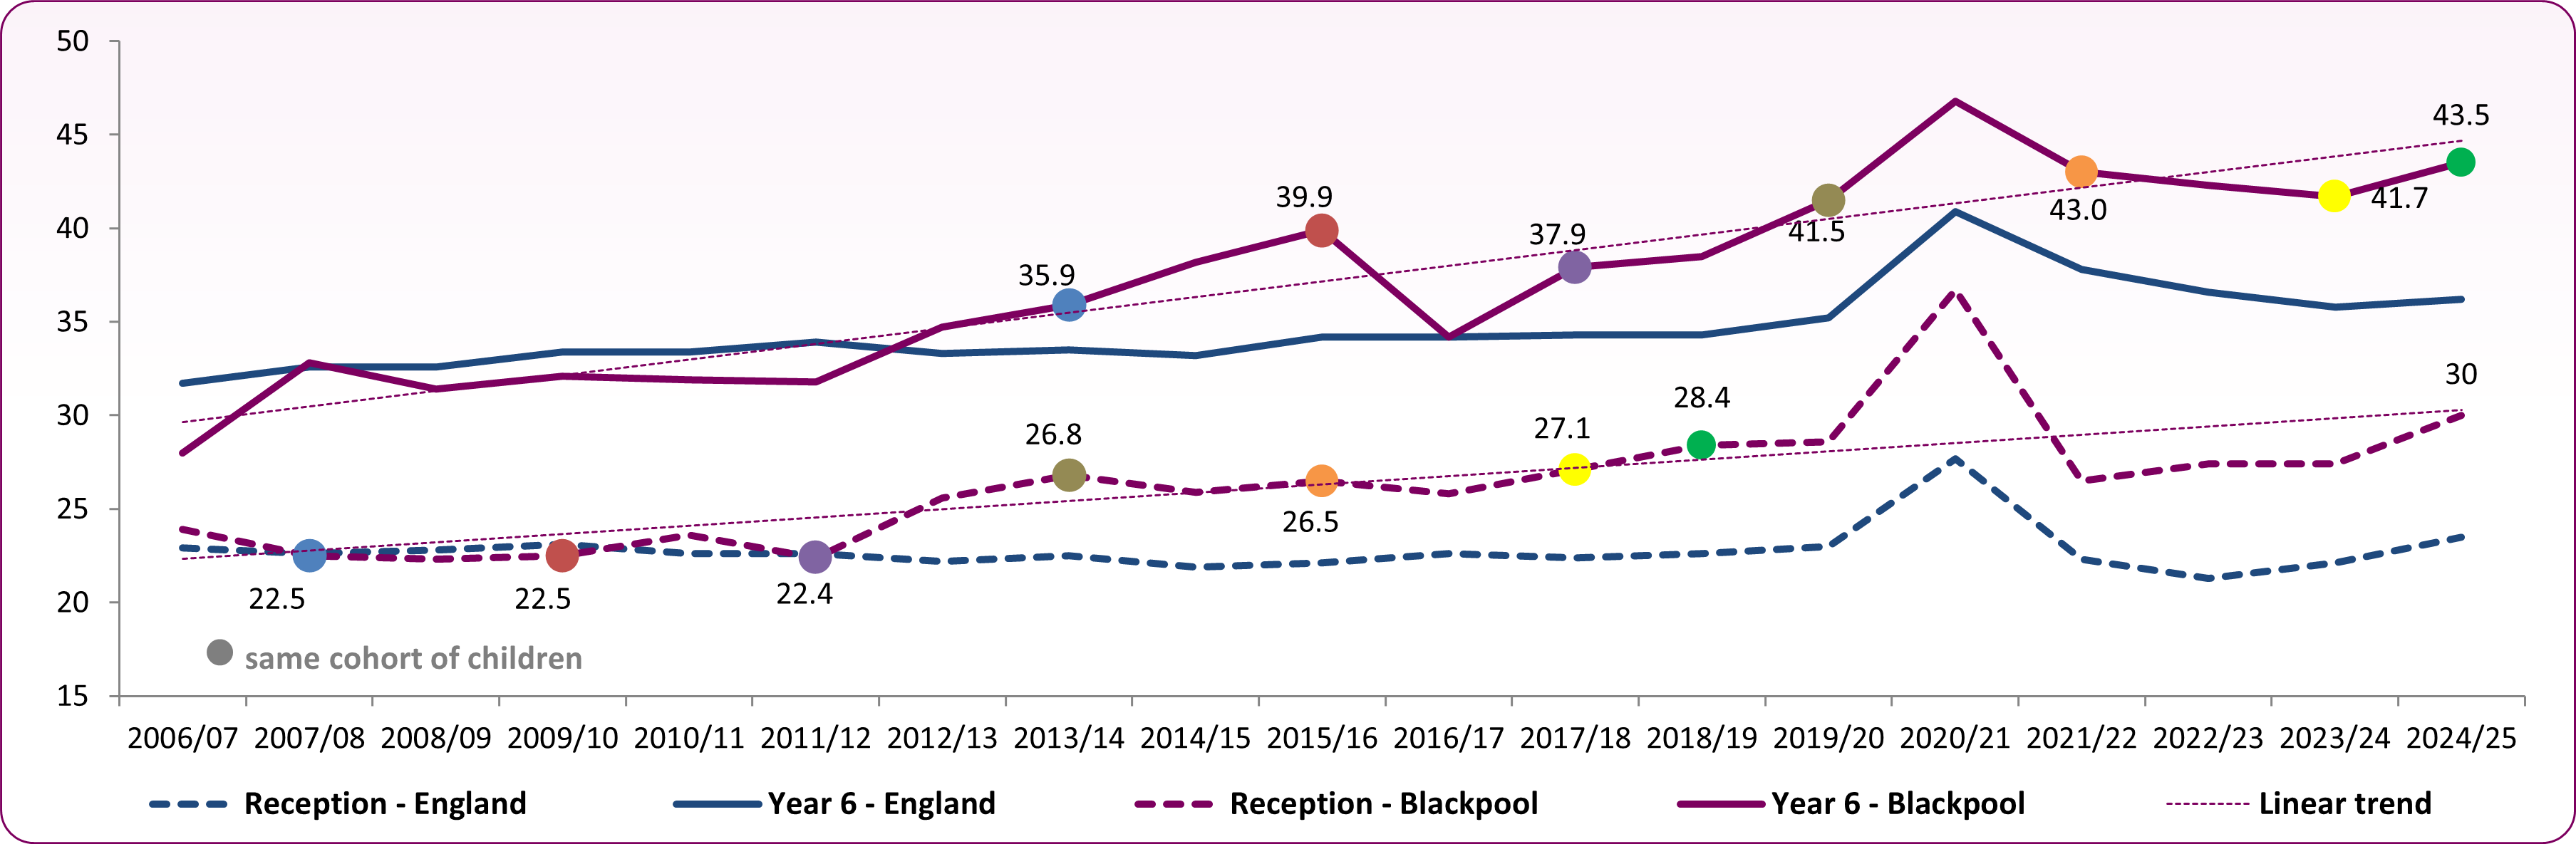 Source: OHID, Fingertips, Obesity Profile
Figure 5 shows the overall trend over time in the prevalence of obese children by year of measurement and school year (reception and year 6). There is clearly an upward trend in levels of obesity in year 6 children in Blackpool where the proportion of pupils who are obese has increased from 16.1% in 2006/07 to 28.3% in 2024/25. This trend in obesity at a national level had almost levelled out by 2019/20 before increasing during the pandemic. Although there had been a fall over the period 2021/22 to 2023/24, it has increased between 2023/24 and 2024/25. The gap between Blackpool and England has narrowed slightly for reception, but for year 6 it has widened in 2024/25.
It can be seen from the cohort comparison (figure 5) that in Blackpool, obesity is increasing between reception age children and Year 6 age children with the proportion classed as obese more than doubling over the time period, with the increase approximately 17 percentage points.
National and local increases in the numbers of overweight and obese children in England reported during the Covid-19 period 2020/21 were a concern, showing the impact of the Covid-19 lockdowns and restrictions on children may have exacerbated existing high levels of excess weight. The increases did appear to be reducing to pre-pandemic trends, however the last weight measurement period shows obesity increasing, so monitoring this trend will be necessary.
Figure 5: trend in obesity prevalence for reception and year 6 showing a cohort comparison, 2006/07 to 2024/25: Blackpool compared to England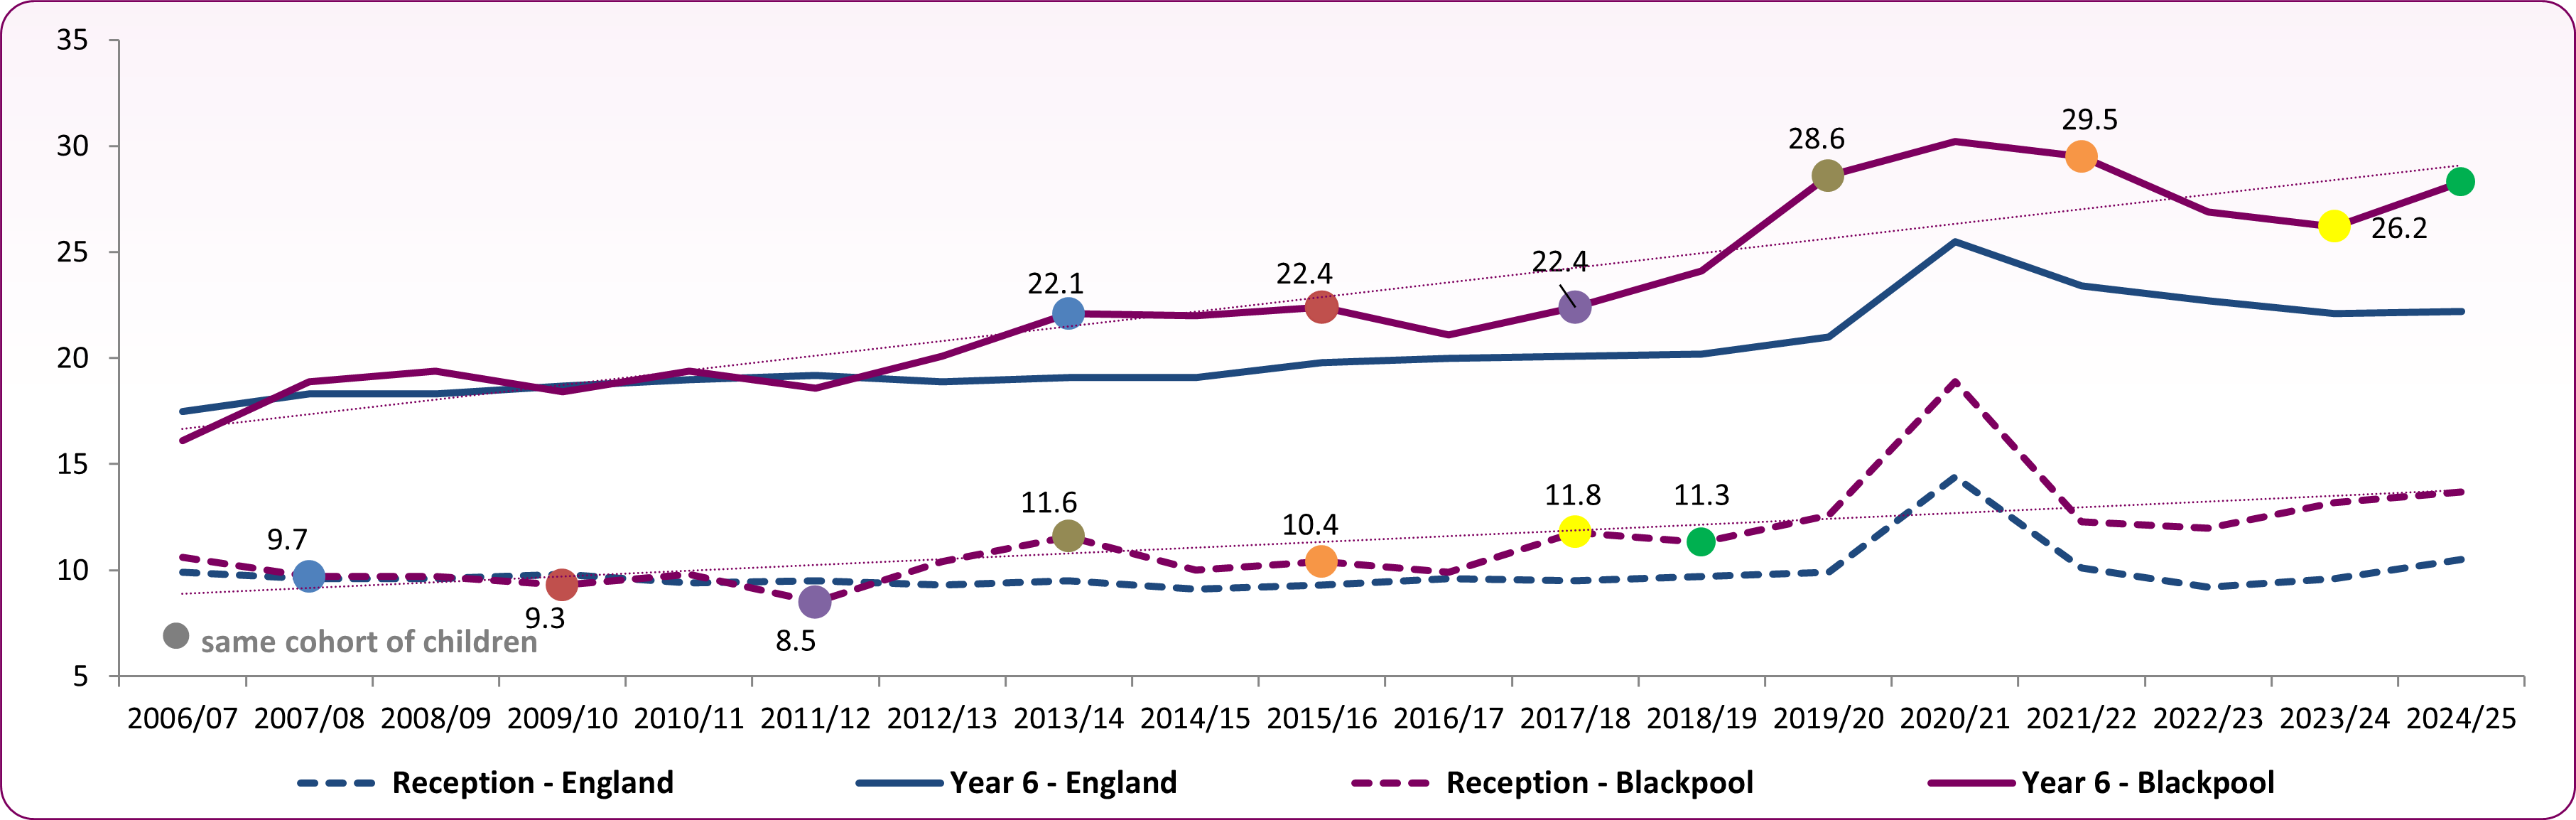 Source: OHID, Fingertips, Obesity Profile
Local variations in children's excess weight
At a local level, there is wide variation in excess weight across Blackpool. Combined data from the NCMP, 2022/23 to 2024/25 (figure 6), shows that excess weight at age 4-5 years ranges from 21.3% in Hawes Side to 35.6% in Park, and obesity ranges from 9.2% in Talbot to 18.0% in Claremont. Brunswick has the highest proportion (48.0%) of children with excess weight at year 6 while Bispham has the lowest proportion (34.0%). Obesity levels in year 6 range from 20% in Bispham to 33.6% in Hawes Side. It can be seen quite clearly that while the proportion of overweight children generally stays the same over time, the rates of obese children tend to double between reception and year 6. Figure 7 shows the local variation in excess weight geographically for the 2022/23-2024/25 period. Care should be taken when interpreting data at ward level as the numbers of children who are overweight or obese in each ward are relatively small and rates do fluctuate over time.
Figure 6: proportion overweight and obese (excess weight) by ward in Blackpool: 2022/23-2024/25 (three-years combined data)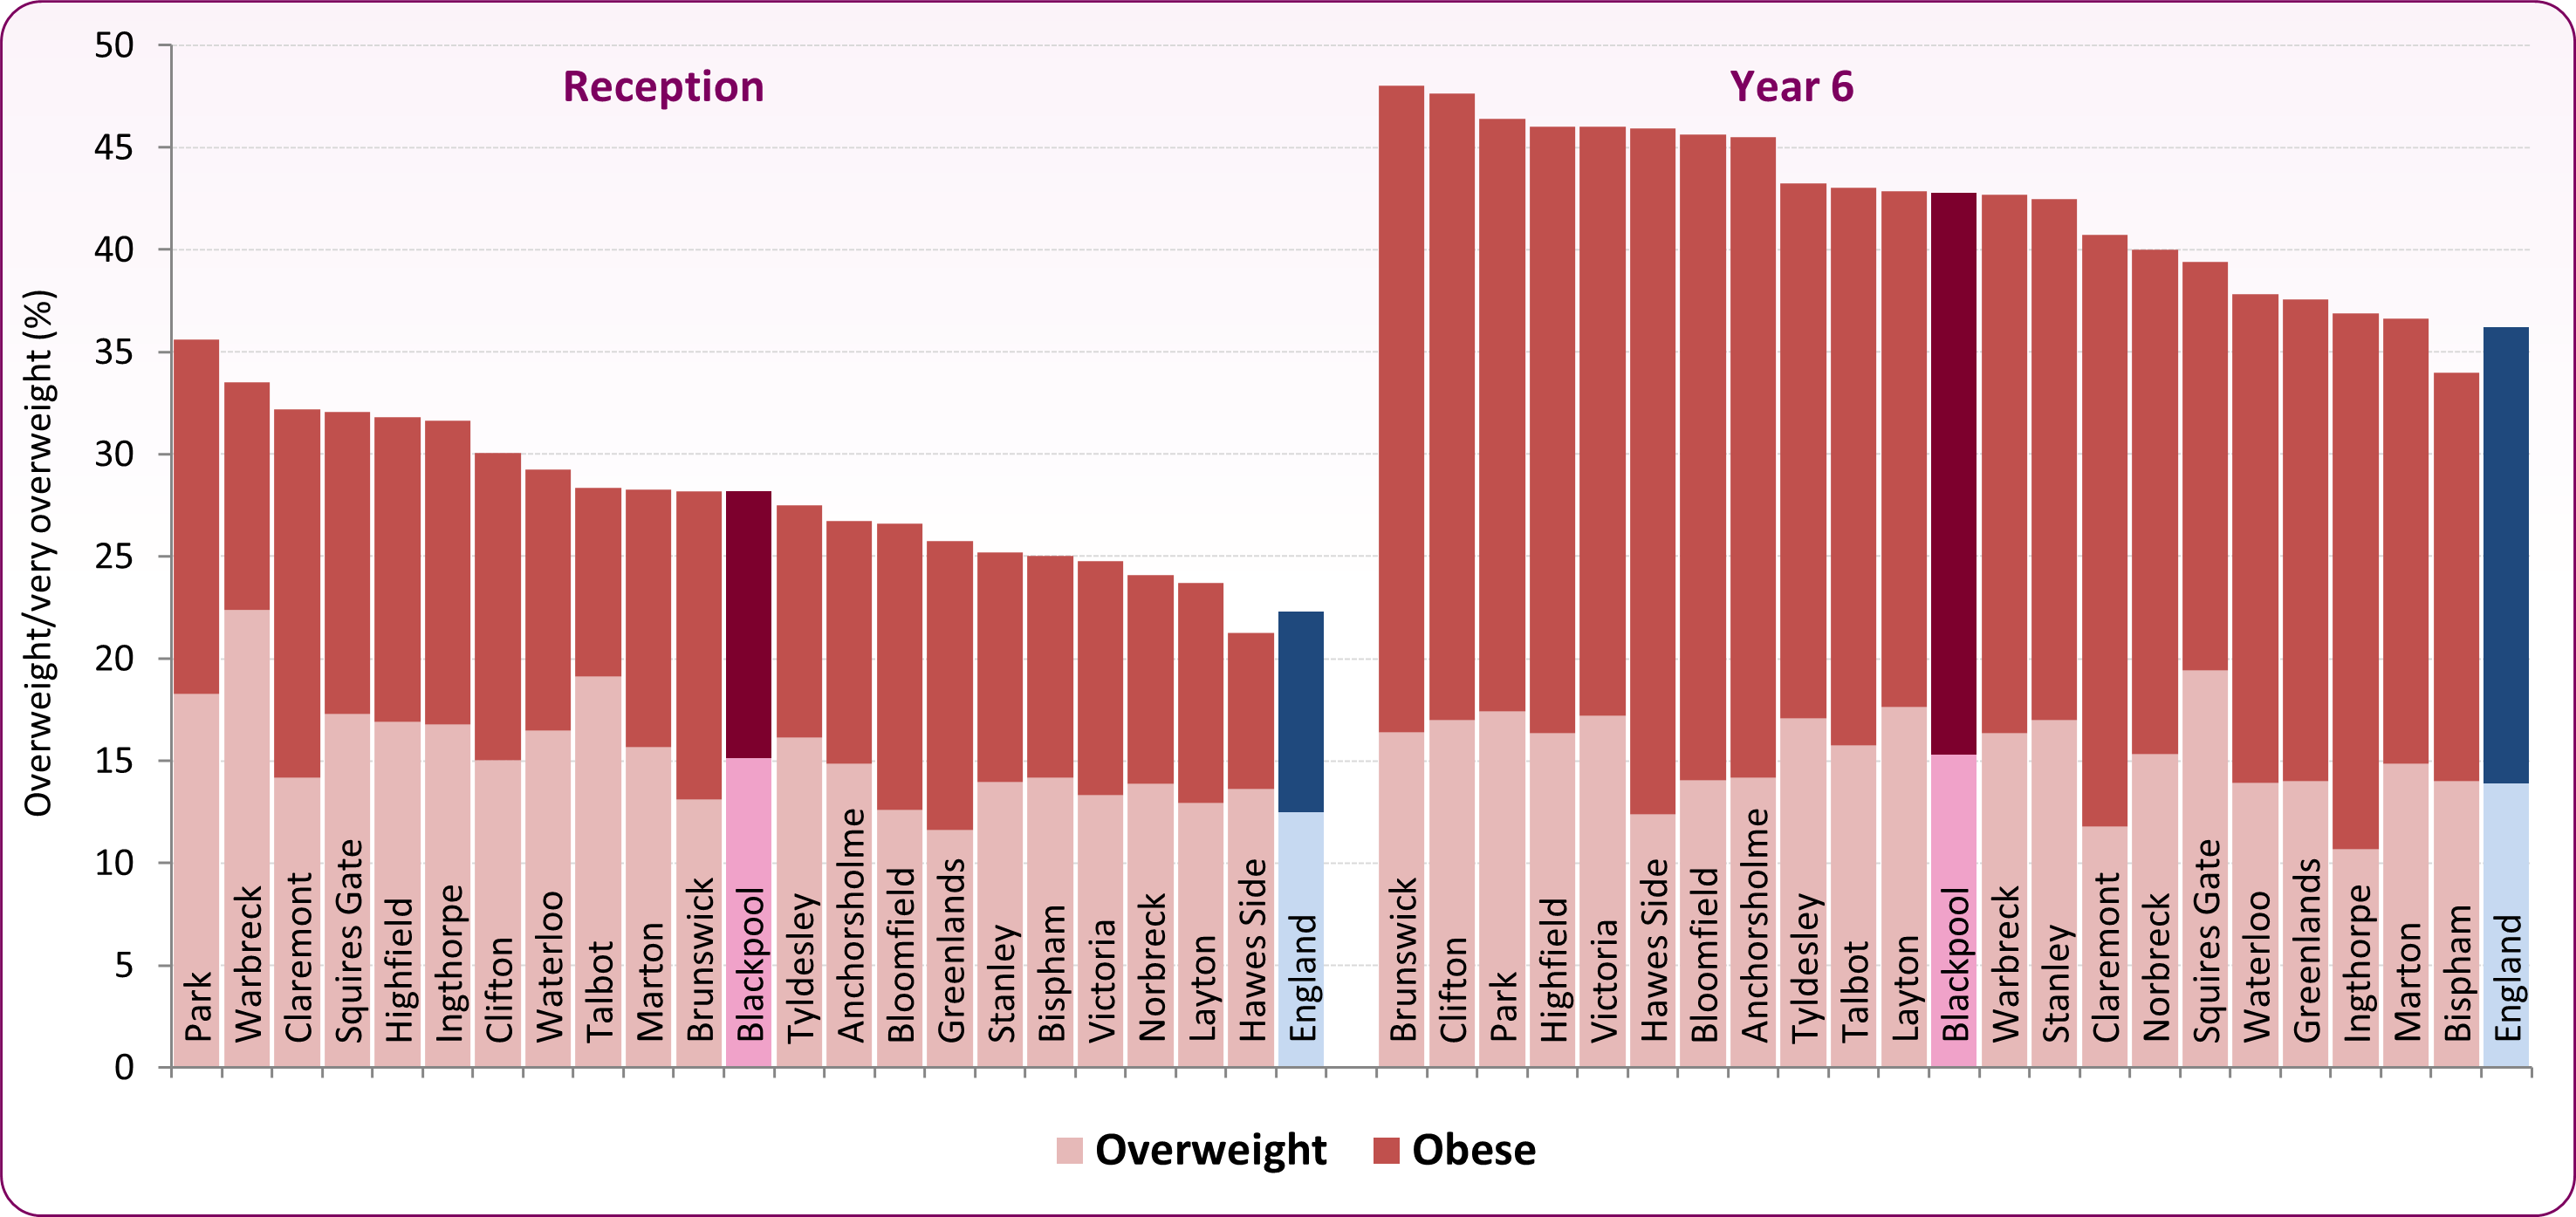 Source: NCMP data - local authority analysis
Figure 7:proportion with excess weight in reception and year 6 children in Blackpool by ward, 2022/23 to 2024/25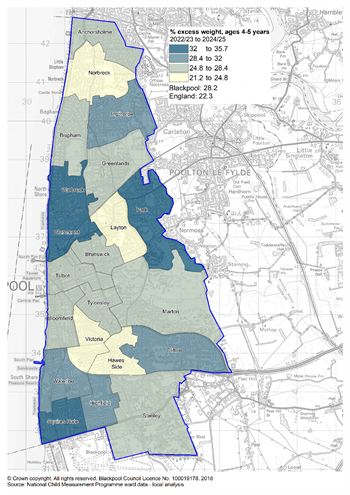
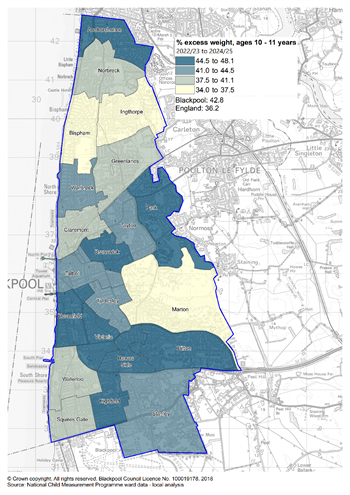
Source: National Child Measurement Programme, local authority analysis, 2022/23 to 2024/25
Perception of own body image
Data from the Health Related Behaviour Survey 2024 showed 25% of boys and 43% of girls in year 6 in Blackpool primary schools reported that they worried ‘quite a lot’ or ‘a lot’ about the way they looked.
Pupils in Blackpool are more likely to say they want to lose weight than is seen nationally with 38% of primary age pupils wanting to lose weight (increasing to 48% by age 15), though 39% of pupils are happy with their weight by the time they are in secondary school. However, the way they look is one of the top four worries of secondary school pupils with 27% of boys and 59% of girls reporting they were concerned about this.
Some studies have found that weight and BMI are correlated with body dissatisfaction, with young people who are overweight or obese reporting greater depressive symptoms and lower self esteem than their peers.4
Disability and obesity: the prevalence of obesity in disabled children
Public Health England (prior to its disbandment) examined the evidence linking disability and obesity among children and young people. The paper looks at a range of impairments or health conditions associated with disability and explores the main obesity-related chronic health conditions that can develop during childhood and adolescence. It also draws attention to the inequalities experienced by children and young people in relation to obesity and disability and highlights implications for policy, practice and research. PHE, Obesity and disability, children and young people  (390 KB)
The report from PHE suggests the risk of obesity among children and young people with disabilities may be related to personal factors such as genetic or metabolic complications, diet, levels of physical activity or use of medications with a side-effect of weight gain.
Environmental factors such as inaccessible neighbourhoods and lack of access to recreational facilities and programs may also play an important role in this relationship. It has been suggested that unusual dietary patterns and fewer opportunities to engage in physical activity may be linked to higher prevalence of obesity in children with developmental disorders, and some conditions, such as Prader Willi syndrome, may give children a predisposition to overeat. Children with autism may be averse to certain textures, flavours or colours, leading them to eat a very limited range of foods, while lack of social participation can also trigger feelings of isolation and result in a risk of overeating in children with disabilities.
While we do not have any Blackpool-specific data on obesity in children who have a disability we do know that 10% of young people (0-19) have been diagnosed with a long-standing illness or disability in Blackpool, and almost 1,000 school children have been identified as having a learning difficulty.5-6
National and local guidance
Blackpool’s Healthy Weight Strategy 2023-2028 (final) details the town’s obesity issues, provides information about why action is required and explores how different stakeholders and partners can contribute to tackling this agenda. This strategy sets out Blackpool’s five-year vision, ambition and priorities.
Childhood obesity: a plan for action (updated January 2017) is the government’s plan for action to significantly reduce childhood obesity by supporting healthier choices.
Childhood obesity: a plan for action, chapter 2 (June 2018) outlines the actions the government will take towards its goal of halving childhood obesity and reducing the gap in obesity between children from the most and least deprived areas by 2030.
NICE Guideline NG246 Overweight and obesity management (updated January 2026) covers the prevention and management of overweight, obesity and central adiposity in children, young people and adults. It brings together and updates all NICE's previous guidelines on overweight and obesity.
NICE Quality Standard QS212 - Overweight and obesity management (August 2025) covers prevention, behavioural management, assessment, and treatment of overweight, obesity and central adiposity in children and young people aged over two years, and adults. It includes those wth established comorbidities and those with risk factors for other medical conditions.
The UK Health Security Agency’s blog posts provide expert insight on the organisation's work relating to obesity: Childhood obesity: 4 important developments and Changing the obesity landscape – 5 ways we’re taking on one of the nation’s biggest health problems.
Services
Active Blackpool's Making Changes is a free lifestyle service for families with children aged between 4 and 11 who want help and advice with maintaining a healthy weight. They can help families with:
- Healthy eating advice, including portion sizes, food labelling and hydration.
- Family exercise sessions with a dedicated instructor.
- A support plan including eating on a budget and cooking at home.
- Sessions in the gym and classes, low rope session, climbing wall session and a bouldering wall session.
- Three months FREE access to Blackpool Council’s sports and leisure facilities on completion of the programme.
[] World Health Organization, WHO acceleration plan to stop obesity, 2023
] Department of Health and Social Care, Fingertips, Obesity Profile [accessed February 2025]
[] Obesity statistics - House of Commons Library, February 2025
] Mental Health Foundation, Body image in childhood [Accessed 25/10/2023]
] PHE, Child Health Profile, Long term conditions and complex health needs
OHID, Learning Disability Profiles