Population
Last Modified 18/03/2026 08:48:57
Share this page
Blackpool Census 2021 facts and figures
The Office for National Statistics (ONS) has published a local area webpage for Blackpool, drawn from the Census 2021 and other sources. Maps and local profiles about Blackpool's population, health and the economy can be found at Blackpool (E06000009) - ONS
Census 2021 population estimates for Blackpool are available here.
Mid-year population estimates 2024
Mid-year population estimates for England and Wales are produced by the Office for National Statistics (ONS). Estimates are produced by updating a census base; the previous year's resident population is aged by one year, and then flows are applied to cover births, deaths, immigration, emigration and people entering and leaving "special populations", such as people in prisons or the armed forces.
According to the 2024 mid-year estimates, the usual resident population of Blackpool is approximately 144,200. This is an increase of 1% from the 2023 mid-year estimates; the overall population of England increased by 1.6% and the North West increased by 1.8% over the same period. Neighbouring Fylde and Wyre also saw population increases of 1.9% and 1.5% respectively.
Blackpool is the third most densely populated local authority in the North West, with 4,135 people per square kilometre (compared to 5,099 in Manchester, 4,551 in Liverpool, 516 in neighbouring Fylde, and 421 in Wyre).
Estimates indicate that older people (65 years plus) account for a greater proportion of Blackpool's resident population than is observed nationally (figure 1). Correspondingly, Blackpool's 0-15 and 16-64 population is lower than is seen across England. Blackpool's 65+ population increased by 1.8% from 2023 while the under 65's saw much small increases.
Figure 1: 2024 population - males and females, all ages, 0-15 years, 16-64 years and 65 and over
| | Total population | Males | Females | Age 0-15 years | Age 16-64 years | Age 65+ years |
|---|
| | No. | No. | % | No. | % | No. | % | No. | % | No. | % |
|---|
|
England
|
58,620,101
|
28,724,339
|
49.0%
|
29,895,762
|
51.0%
|
10,768,248
|
18.4%
|
36,870,761
|
62.9%
|
10,981,092
|
18.7% |
|
Blackpool
|
144,191
|
71,740
|
49.8%
|
72,451
|
50.2%
|
25,618
|
17.8%
|
88,588 |
61.4%
|
29,985
|
20.8% |
| Source: Office for National Statistics, Population estimates for England and Wales, 2024, July 2025 |
Figure 2 gives Blackpool population estimates by males and females and by five-year age group. People aged 50-69 make up over a quarter (27.3%) of Blackpool's population (24.1% nationally). 22.2% of Blackpool's population is aged under 20 (23.1% nationally), and 10.1% are aged 75 and above (9.3% nationally). Overall, there are significantly more people aged over 50 in Blackpool (42.2%) than is seen nationally (37.8%).
Figure 2: 2024 mid-year population estimates by sex and age group - Blackpool
| | Males | Females | Persons | % |
|---|
| All ages |
71,740 |
72,451 |
144,191 |
|
|---|
| 0-4 |
3,801 |
3,548 |
7,349 |
5.1% |
|---|
| 5-9 |
4,135 |
4,101 |
8,236 |
5.7% |
|---|
| 10-14 |
4,230 |
4,105 |
8,335 |
5.8% |
|---|
| 15-19 |
4,310 |
3,782 |
8,092 |
5.6% |
|---|
| 20-24 |
3,823 |
3,418 |
7,241 |
5.0% |
|---|
| 25-29 |
4,208 |
4,250 |
8,458 |
5.9% |
|---|
| 30-34 |
4,725 |
5,005 |
9,730 |
6.7% |
|---|
| 35-39 |
4,684 |
5,044 |
9,728 |
6.7% |
|---|
| 40-44 |
4,306 |
4,225 |
8,531 |
5.9% |
|---|
| 45-49 |
3,870 |
3,775 |
7,645 |
5.3% |
|---|
| 50-54 |
4,712 |
4,753 |
9,465 |
6.6% |
|---|
| 55-59 |
5,508 |
5,401 |
10,909 |
7.6% |
|---|
| 60-64 |
5,348 |
5,139 |
10,487 |
7.3% |
|---|
| 65-69 |
4,299 |
4,176 |
8,475 |
5.9% |
|---|
| 70-74 |
3,327 |
3,446 |
6,773 |
4.7% |
|---|
| 75-79 |
3,132 |
3,511 |
6,643 |
4.6% |
|---|
| 80-84 |
1,843 |
2,371 |
4,214 |
2.9% |
|---|
| 85-89 |
1,030 |
1,571 |
2,601 |
1.8% |
|---|
| 90+ |
449 |
830 |
1,279 |
0.9% |
|---|
Population pyramid
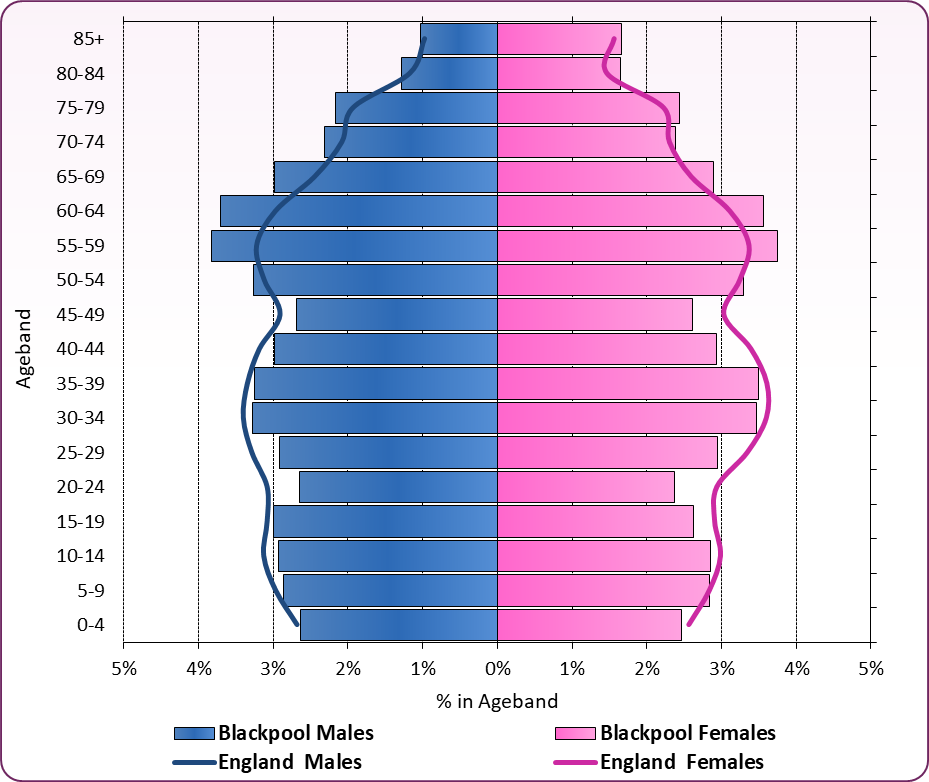
Blackpool's population pyramid (figure 3) shows the differences across the age groups compared to England, with higher proportions of those aged 50 and over in Blackpool (males and females). There are lower proportions in the under 50s. Blackpool reflects England's higher proportion of females in the older age bands than males.
Figure 3: mid-year 2024 population pyramid - Blackpool and England
 Source: Office for National Statistics, Population estimates for England and Wales, 2024, July 2025
Figure 4 and figure 5 show the household composition and household size for Blackpool from the 2021 Census. Blackpool has more single-person housholds compared to North West and England, reflecting the housing stock and population of the area. Almost a quarter (24.8%) of Blackpool's households have dependent children (North West 28%, England 28.5%). Of these, 9% are lone parent households (North West 7.7%, England 6.9%). The interactive map provides further breakdowns.
Figure 5: Household size - Blackpool, North West and England, 2021
| | Blackpool | North West | England |
|---|
| Number of households |
64,367 |
3,009,549 |
22,063,368 |
| One person |
38.0% |
32.2% |
30.1% |
| Two people |
32.4% |
33.5% |
34.2% |
| Three people |
14.5% |
15.7% |
15.6% |
| Four people |
9.9% |
12.2% |
13.0% |
| Five people |
3.6% |
4.3% |
4.7% |
| Six or more people |
1.6% |
2.1% |
2.4% |
Source: NOMIS - official Census statistics (TS003 - household composition)
|
The total population of Blackpool is projected to increase slightly (5%) in the long term, going from 141,975 in 2023 to 148,960 by 2047 (ONS 2022-based subnational population projections). In comparison, the population of England is projected to rise by 11% over the same period.
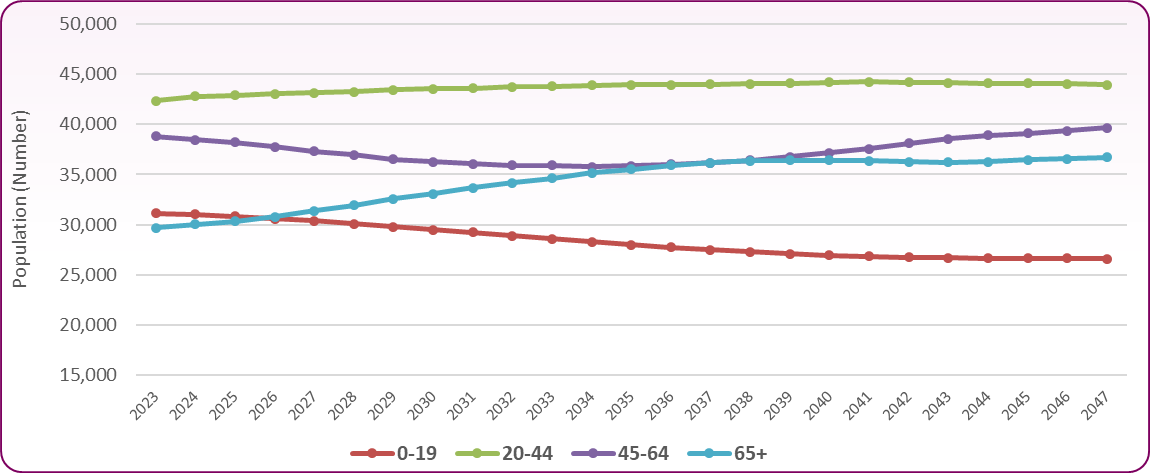
Projections for Blackpool show the number of residents over-65 will increase considerably over the next 25 years, far in excess of the levels shown in all other age bands (figure 6). The over-65 population is projected to rise by 24% from 29,700 in 2023 to almost 36,700 in 2047 and will then make up a quarter (25%) of Blackpool's total population.
The 0-19 year-old population shows the greatest decrease over time, falling 14% from 31,100 to 26,600.
Figure 6: 2022-based subnational population projections for Blackpool
 Source: ONS 2022-based subnational population projections
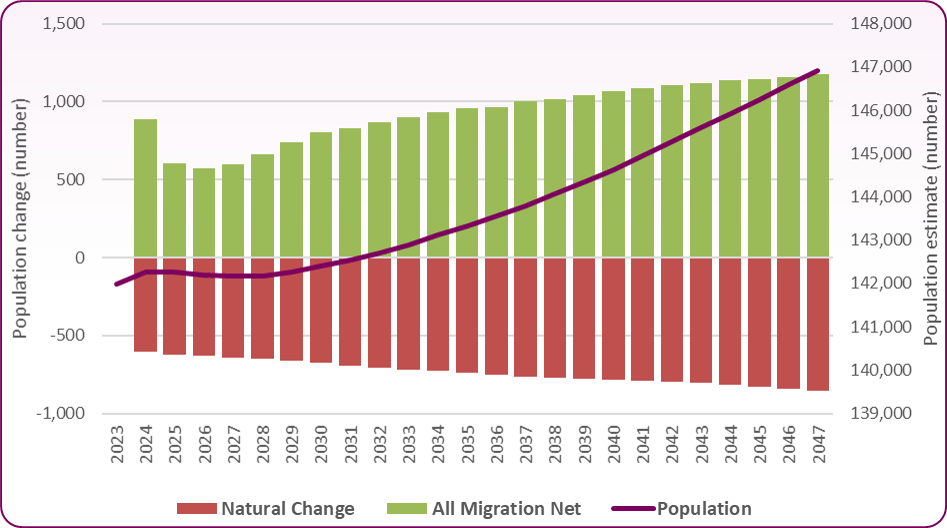
There are four factors that affect population change: birth rate, death rate, immigration and emigration. The difference between the number of births and the number of deaths is the net change in population due to natural change. Immigration and emigration figures reflect those entering or leaving Blackpool from or to other areas of England, the UK or internationally. Figure 7 displays projected changes in Blackpool's population from natural change, immigration and emigration. The main contributory factor in the initial fall in population is that natural change is relatively static with more deaths than births in the town, with the decrease in population partly offset by a small increase in immigration. The levelling off in the late 2020's followed by a projected population rise is primarily due to immigration increasing rather than increase in natural change. ONS data suggests that over 90% of immigration comes from other areas of England and the rest of the UK, with this proportion expected to increase to 95% by the early 2030s.
Figure 7: projected components of population change - Blackpool
 Source: ONS 2022-based Population projections by components of change
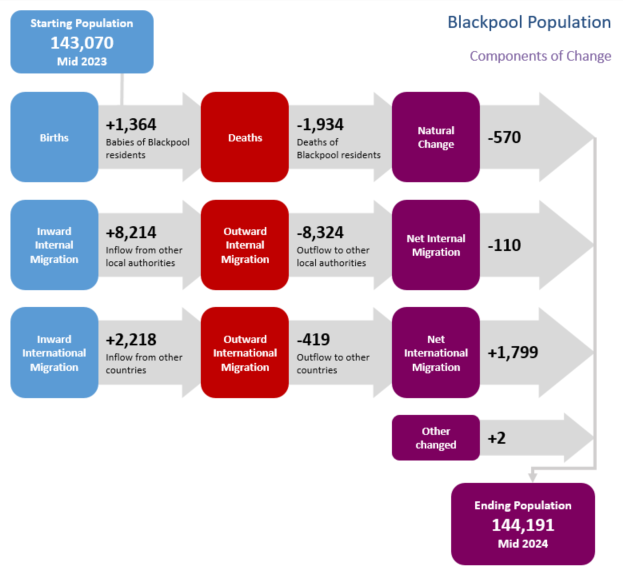
Population turnover statistics show that inward international migration acounts for much of the increase in Blackpool's resident population between 2023 and 2024. Although across England, local authorities with higher education establishments see large population increases due to international migration this is probably not the case for Blackpool. A high proportion of the inward international migration may be people coming to work in the health and socal care sector and tourism as well as some asylum seekers placed within the authority.
Figure 8 summarises the inflows and outflows in Blackpool over the course of a single year.
Figure 8: population inflows and outflows in Blackpool - mid-year 2023 to 2024 change
Source: Office for National Statistics, Population estimates for England and Wales: mid-2023, July 2024