Births and Deaths
Last Modified 11/06/2026 15:33:35
Share this page
The ratio of births to deaths (figure 1) in Blackpool has shown a consistently greater number of deaths than births apart from in 2014. By comparison there has been consistently more births than deaths across England as a whole, though the ratio fell between 2012 and 2025.
In COVID-19 affected 2020, the birth to death ratio fell sharply in Blackpool and has not returned back to the previous level. In Blackpool there were 257 more deaths and 90 fewer live births recorded than the previous year (figure 2), resulting in the birth to death ratio falling from 0.86 to 0.71 (71 births per 100 deaths). This reducing ratio was also reflected nationally, where there was a 6% decline in live births and a 14% increase in recorded deaths compared to 2019, though there were still more births than deaths across England.
2025 statistics show a similar number of deaths as in 2024. In Blackpool the number of births increased slightly to 1,39 births, 38 more (3%) than the previous year. This resulted in the birth to death ratio increasing slightly to to 0.73 (73 births per 100 deaths). Nationally the birth to death ratio was 1.05.
Figure 1 - births/deaths ratio: Blackpool and England
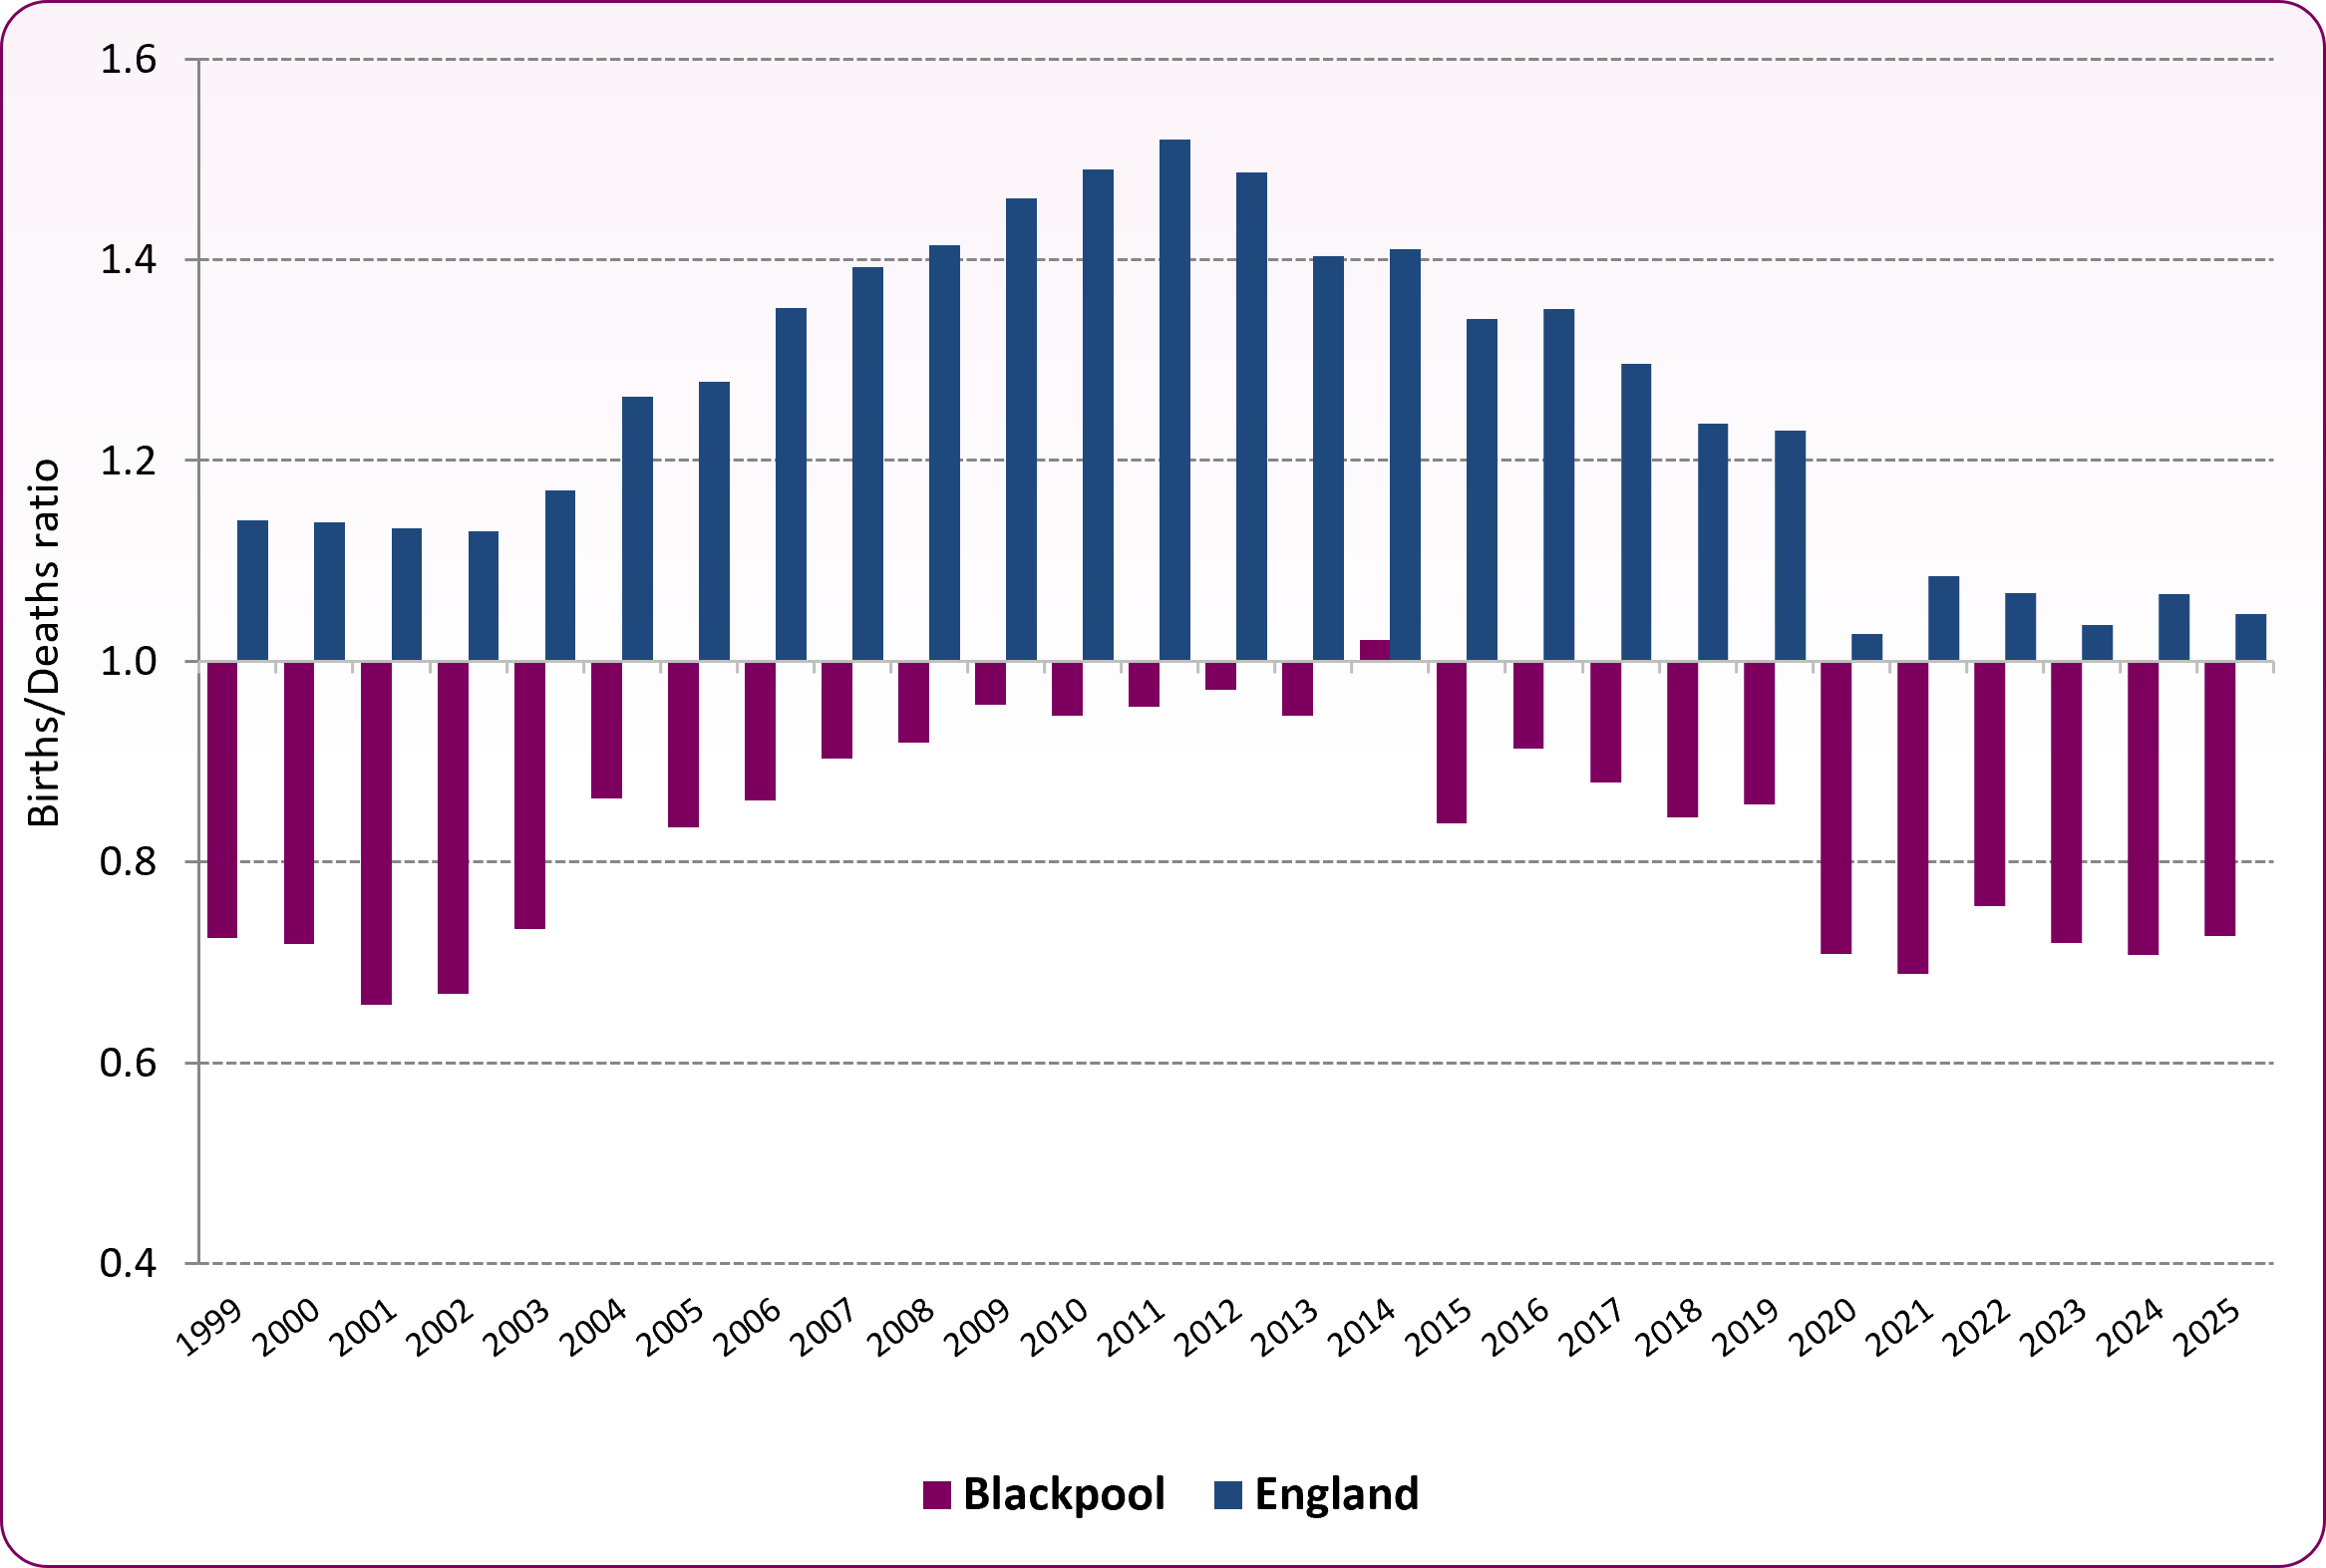 Source: ONS birth and death summary tables
Figure 2: trend in births and deaths ratio in Blackpool
| Year | Live births | Deaths - all ages | Births/Deaths Ratio |
|---|
|
1999
|
1,528
|
2,109
|
0.72
|
|
2000
|
1,523
|
2,120
|
0.72
|
|
2001
|
1,397
|
2,124
|
0.66
|
|
2002
|
1,403
|
2,100
|
0.67
|
|
2003
|
1,549
|
2,114
|
0.73
|
|
2004
|
1,686
|
1,953
|
0.86
|
|
2005
|
1,649
|
1,976
|
0.83
|
|
2006
|
1,655
|
1,921
|
0.86
|
|
2007
|
1,694
|
1,876
|
0.90
|
|
2008
|
1,745
|
1,900
|
0.92
|
|
2009
|
1,725
|
1,803
|
0.96
|
|
2010
|
1,777
|
1,880
|
0.95
|
|
2011
|
1,735
|
1,818
|
0.95
|
|
2012
|
1,770
|
1,822
|
0.97
|
|
2013
|
1,717
|
1,816
|
0.95
|
|
2014
|
1,819
|
1,782
|
1.02
|
|
2015
|
1,665
|
1,986
|
0.84
|
|
2016
|
1,700
|
1,862
|
0.91
|
|
2017
|
1,643
|
1,868
|
0.88
|
|
2018
|
1,617
|
1,915
|
0.84
|
|
2019
|
1,570
|
1,832
|
0.86
|
|
2020
|
1,480
|
2,089
|
0.71
|
|
2021
|
1,423
|
2,067
|
0.69
|
|
2022
|
1,438
|
1,969
|
0.76
|
|
2023
|
1,402
|
1,949
|
0.72
|
|
2024
|
1,353
|
1,913
|
0.71
|
|
2025
|
1,391
|
1,916
|
0.73
|
Source: ONS birth and death summary tables