Deprivation
Last Modified 10/12/2025 13:13:53
Share this page
Summary points for commissioners
-
- Blackpool continues to be ranked as the most deprived local authority in England on both the rank and score measures.
- Ten of the 20 most deprived areas in England are in Blackpool (down from 12 in 2019).
- Almost two-fifths (38%) of adults in Blackpool are living in one of the 10% most income deprived areas in England.
- Just over a quarter (26%) of adults in Blackpool are living in one of the 10% most employment deprived areas in England.
- Blackpool ranks as the 14th most deprived local authority in terms of income deprivation which affects children.
- Blackpool is the 28th most deprived local authority in terms of income deprivation which affects older adults.
- Blackpool has 40% of lower-layer super output areas (LSOAs) in the 10% most deprived areas, ranking sixth in England (down from 41% in 2019).
- Looking at the individual domains:
- the number of LSOAs in the 10% deprived for income, employment, health, and environment has decreased.
- the number of LSOAs in the 10% most deprived for education, and crime has increased.
Introduction
The 2025 English Index of Multiple Deprivation (IMD) was released on 30 October 2025, updating the 2019 index. It is made up of baskets of indicators covering seven topics, or 'domains', which are weighted according to their perceived contribution towards deprivation. Some of the domains are treated as having more influence on deprivation than others, and are are given a larger weight. These domains are:
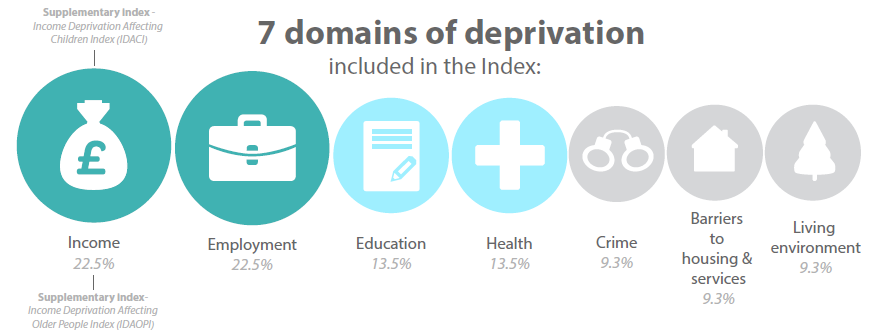
Table 1: IMD deprivation domains and description
| Domain | Description |
|---|
| Income deprivation |
Proportion of people experiencing low income |
| Employment deprivation |
Proportion of working-age people involuntarily excluded from the labour market |
| Education, skills and training |
Lack of attainment and skills in children and adults |
| Health and disability |
Risk of premature death and impairment of quality of life |
| Crime |
Risk of personal and material victimisation |
| Barriers to housing and services |
Physical and financial accessibility of housing and key local services |
| Living environment |
Quality of the local environment; indoors and outdoors |
Note: the weighting has remained the same for the 2025 IMD as for the 2019 index.
Individual indicators within the index are subject to change depending on the availability of the data, meaning different iterations of the index are not totally comparable, but the indices can show change over time in relative deprivation levels.
The index ranks four different geographies:
-
- Lower-layer super output areas (LSOAs) – these are units of geography smaller than wards and contain around 1,500 residents. A rank of 1 indicates the most deprived LSOA, and 33,755 the least deprived.
- Local authority (LA) level, based on an aggregated version of the LSOA data, where a rank of 1 indicates the most deprived local authority area, and 296th indicates the least deprived.
- Local enterprise partnership area (ranked from 1-38)
- Integrated care board area (ranked from 1-42)
This page reports on the headline LSOA level and LA level rankings. There are several ways of measuring deprivation in all of these types of area. Explanations of the different rankings are provided throughout the page.
Detailed facts and figures
Blackpool’s deprivation rankings since 2007
For the 2019 index, the Ministry of Housing, Communities and Local Government (MHCLG) reported the rank of local authority areas obtained from calculating the proportion of LSOAs in the area which fall into the most deprived 10% in the country. Using this measure for 2025, the figures show that Blackpool remains ranked as sixth most deprived authority, although this has reduced from 41.5% in 2019 to 40% in 2025. This equates to 38 of our LSOAs
Historically, the deprivation ranking usually quoted was based on an average for all LSOAs – based on the deprivation scores obtained from the indicators in each of the seven domains. On this measure Blackpool remains the most deprived local authority area in the country, as can be seen in the table below.
Deprivation in Blackpool 2007-2025
| Ranking measure | 2007 | 2010 | 2015 | 2019 | 2025 | Change |
|---|
|
Rank of average score
Ranks the authority based on average deprivation scores for all LSOAs.
|
12th
|
6th
|
1st
|
1st
|
1st
|
~0
|
|
Local concentration
Ranks the area by an average of LSOA rankings covering 10% of the population. Areas are selected in order from most deprived.
|
3rd
|
1st
|
1st
|
1st
|
1st
|
~0
|
|
Rank of average rank
Ranks the authority based on the average deprivation rankings for all LSOAs
|
18th
|
10th
|
4th
|
1st
|
1st
|
~0
|
|
Rank of LSOAs in most deprived 10%
Ranks the authority based on the % of LSOAs in the 10% most deprived areas nationally
|
-
|
9th
|
7th
|
6th
|
6th
|
~0
|
|
Extent
Ranks the authority based on an average of LSOA rankings in the most 30% deprived nationally
|
24th
|
16th
|
12th
|
5th
|
8th
|
+3
|
|
Employment scale
Ranks the authority based on the absolute number of people who are income deprived
|
61st
|
63rd
|
61st
|
59th
|
72nd
|
+13
|
|
Income scale
Ranks the authority based on the absolute number of people who are income deprived
|
72nd
|
74th
|
68th
|
61st
|
86th
|
+27
|
Source: Indices of Deprivation, Department for Communities and Local Goverment, 2025
The other overall ranks are variations of these. The rank of local concentration is a reference to the 'intensity' of the deprivation amongst the 10% most deprived of the population, rather than a reference to deprived areas all being in one part of Blackpool. It is calculated by adding up the number of people living in the most deprived areas until 10% of Blackpool’s total population is reached, and using the ranks of these LSOA areas to produce a concentration score, which is then compared to the figure for other areas to produce a rank. The rank of local extent looks at neighbourhoods in the bottom 30%.
In previous iterations of the index, only the employment and income domains (the two domains with the most influence on the overall deprivation ranking) were ranked, based on the total numbers of people included in the calculation of the indicators. These are therefore different to the other ranks, as they cover numbers of people and not performance indicators. The change in these rankings therefore show that Blackpool has the 72nd and 86th biggest number of people affected by deprivation in these domains compared to other local authority areas across the country.
Domain rankings 2025
The MHCLG ranks each of the individual domains, plus the two other deprivation products calculated from the same source data: 'Income Deprivation Affecting Children', and 'Income Deprivation Affecting Older People'. These show how the relative position of Blackpool varies across the domains, with performance on 'Barriers to Housing and Services', 'Living Environment', and 'Education and Skills' the only ones outside the bottom 10 authority areas.
Blackpool deprivation domain rankings
| Indices of deprivation domain | Rank of average score | Rank of most deprived 10% |
|---|
| Index of Multiple Deprivation* |
1 |
6 |
| Income |
7 |
17 |
| Employment |
1 |
5 |
| Education, skills and training |
11 |
13 |
| Health deprivation and disability |
1 |
2 |
| Crime |
1 |
4 |
| Barriers to housing and services |
251 |
222 |
| Additional indices | | |
|---|
| Income deprivation affecting children |
11 |
16 |
| Income deprivation affecting older people |
32 |
33 |
*This combines the seven domains into a ‘single score’ of deprivationSource: Indices of Deprivation, Department for Communities and Local Goverment, 2025
Deprivation in neighbourhoods - lower super output areas
The table below shows how the level of deprivation across LSOAs has changed since the publication of the 2019 index. Overall, there has been a reduction in the number of LSOAs in the 30% most deprived areas compared to 2019, with 63% of LSOAs in deciles 1 - 3 in 2025 (2019 = 75%). Blackpool now has one LSOA in deprivation decile 8, but still has none in deciles 9 and 10 (least deprived).
Percentages of LSOAs in each deprivation decile
| |
Number of LSOAs | % in Decile |
| National Decile | 2019 | 2025 | 2019 | 2025 |
|---|
| 1 - most deprived 10% |
39 |
38 |
41% |
40% |
| 2 |
16 |
13 |
17% |
14% |
| 3 |
16 |
8 |
17% |
9% |
| 4 |
14 |
19 |
15% |
20% |
| 5 |
5 |
7 |
5% |
7% |
| 6 |
1 |
4 |
1% |
4% |
| 7 |
3 |
4 |
3% |
4% |
| 8 |
0 |
1 |
0% |
1% |
| 9 |
0 |
0 |
0% |
0% |
| 10 - least deprived 10% |
0 |
0 |
0% |
0% |
Source: Indices of Deprivation, Department for Communities and Local Goverment, 2025
The chart below shows how the 2025 distribution compares to the local, regional and national picture. Blackpool has a greater proportion of areas in the most deprived deciles than the least deprived:

LSOA map – overall picture of deprivation in Blackpool
The following map shows the picture on deprivation at LSOA level. The colours represent the level of deprivation in the area, with the more deprived areas the darkest. The boundaries of the LSOAs are included within the ward boundaries to understand the granularity of deprivation within each ward.
 Note: Blackpool does not have any LSOAs in deciles 9 or 10 (the least deprived)