Low Birth Weight
Last Modified 31/07/2025 12:10:04
Share this page
Introduction
Low birth weight increases the risk of infant mortality and of developmental problems for the child and is associated with poorer health in later life. Over half of deaths in childhood occur during the first year of a child’s life, and are strongly influenced by pre-term delivery and low birth weight; with risk factors including maternal age, smoking and disadvantaged circumstances.1
At a population level there are inequalities in low birth weight; rates of low birth weight are higher in less advantaged socio-economic groups, and are particularly linked to a number of negative health behaviours such as poor prenatal care, substance abuse, poor nutrition during pregnancy and smoking which are more common in these groups. In addition there is a relation between teenage pregnancy and low birth weight, where there is competition for nutrients between the fetus and the growth needs of the mother. Inadequate nutrition can also drive low birth weights.1
Low birth weight births are defined in two ways:
-
-
Live births with a recorded birth weight under 2,500g and a gestational age of at least 37 complete weeks.
-
All births (live and still births) with a recorded birth weight under 2500g as a percentage of all live births with stated birth weight
Very low birth weight births are:
This indicator is in line with the Government's direction for public health on starting well through early intervention and prevention and is included within the Public Health Outcomes Framework. It has also been included in the Department of Health Business Plan within the context of addressing issues of premature mortality, avoidable ill health, and inequalities in health, particularly in relation to child poverty.
Facts and figures
Figure 1 shows that there have been a consistently higher proportion of low birth weight infants born to Blackpool mothers than in the North West and England as a whole.
In 2022, 3.1% of infants who reached 37 weeks gestation, born to Blackpool resident mothers, weighed less than 2,500g. This was 40 infants born in 2022.
Figure 1: trend in low birth weight of term babies 2006-2022
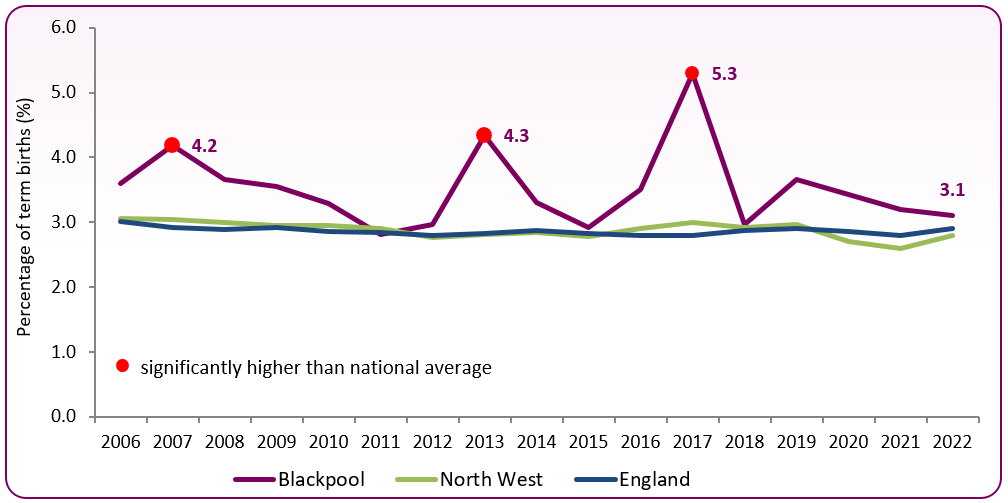 Source: OHID, Public Health Profiles
Figure 2: trend in low birth weight of term babies
| | 2010 | 2011 | 2012 | 2013 | 2014 | 2015 | 2016 | 2017 | 2018 | 2019 | 2020 | 2021 | 2022 |
|---|
| England |
2.9 |
2.8 |
2.8 |
2.8 |
2.9 |
2.8 |
2.8 |
2.8 |
2.9 |
2.9 |
2.9 |
2.8 |
2.9 |
| North West |
2.9 |
2.9 |
2.8 |
2.8 |
2.8 |
2.8 |
2.9 |
3.0 |
2.9 |
3.0 |
2.7 |
2.6 |
2.8 |
| Blackpool (number and %) |
52 |
44 |
46 |
65 |
53 |
43 |
52 |
76 |
42 |
50 |
44 |
41 |
40 |
| 3.3 |
2.8 |
3.0 |
4.3 |
3.3 |
2.9 |
3.5 |
5.3 |
3.0 |
3.7 |
3.4 |
3.2 |
3.1 |
In 2022 across Blackpool, there were a total of 135 babies born weighing less than 2500g and 17 weighing less than 1500g. Figure 3 shows the recent trend in low birth weight babies under 2500g and very low weight babies under 1500g for all births. While rates for Blackpool were generally similar to the national average in 2021, low birth weights and very low weight births have increased in 2022. Overall very low birth weights have fallen over from 1.7% in 2011 to 1.2% in 2022 (0.7% in 2021).
Figure 3: trend in low and very low birth weight of all babies, 2010-2022
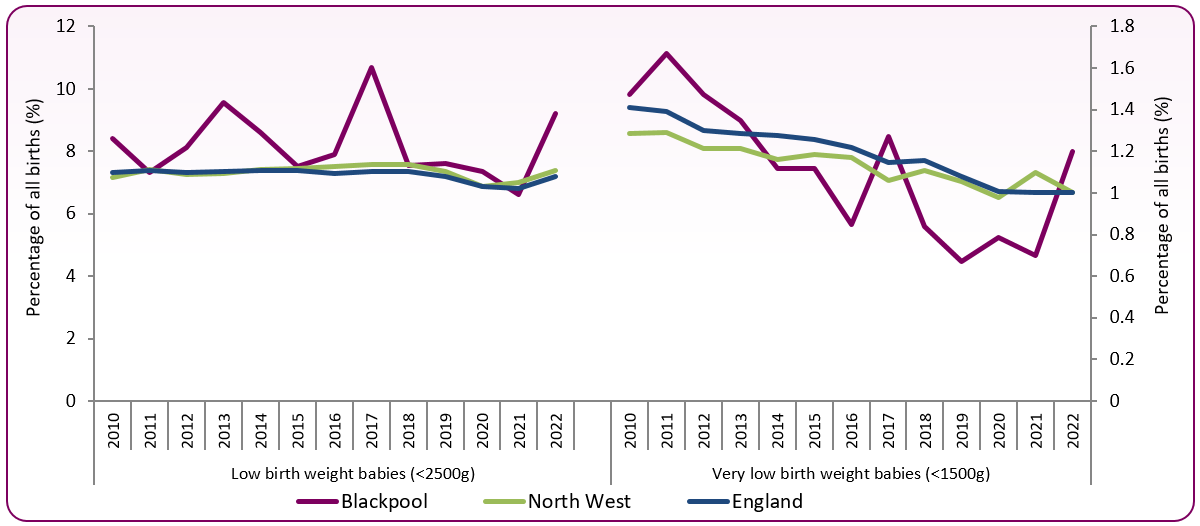 Source: OHID, Public Health Profiles
There is variation in low birth weight rates across Blackpool and figures from the Office for Health Improvement and Disparities (OHID) show that Claremont (10.3%) and Talbot (12%) have significantly higher rates of low weight births than the England average. Over the 5 year period 2016 to 2020, 105 babies born in these wards weighed less than 2500g. At the other end of the scale, Norbreck has the lowest proportion of low weight births (3.2%). Figure 4 shows the variation across the wards in Blackpool (note, this is the most up to date data as of March 2025).
Figure 4: births with birth weight less than 2500g as a proportion of live births, 2016-2020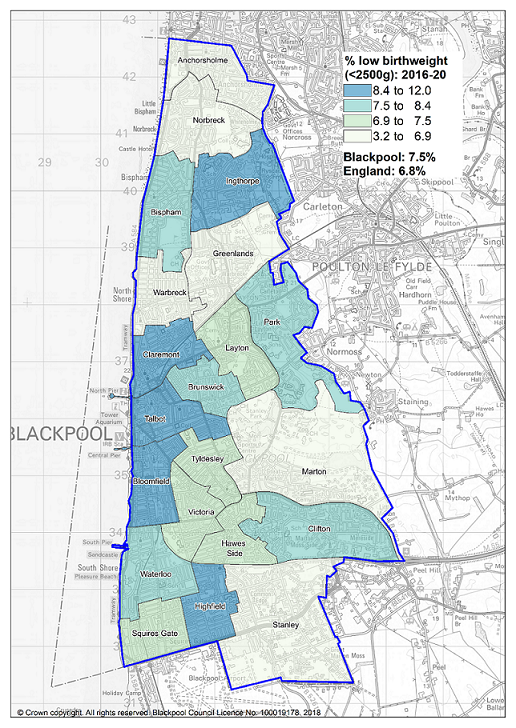 Source: OHID, Local Health Profiles
Risk factors
Maternal factors can affect placental transfer of nutrients - eg, low pre-pregnancy weight, under-nutrition, substance abuse or severe anaemia. Medical conditions can affect placental implantation and vasculature and hence transfer - eg, pre-eclampsia, auto-immune disease, thrombophilias, renal disease, diabetes and essential hypertension.2
Minor risk factors
-
- Maternal age ≥35 years
- IVF singleton pregnancy
- Nulliparity (a woman who hasn't previously given birth, but may have been pregnant)
- BMI <20
- BMI 25-34.9
- Smoker - 1-10 cigarettes per day
- Low fruit intake pre-pregnancy
- Pregnancy interval <6 months
- Pregnancy interval ≥60 months
Major risk factors
- Maternal age >40 years
- Smoker - ≥11 cigarettes per day
- Paternal or maternal small for gestational age (SGA)
- Maternal tobacco smoking is the key environmental risk factor for low birth weight. Passive maternal smoking is also a risk factor
- Poor nutrition
- Drug use
- Alcohol abuse
- Heart disease or hypertension
- Younger mother
National and local strategies
-
Antenatal care (National Institute for Health and Care Excellence, 2021) - Guidelines cover advice and information to be given to women during pregnancy, including antenatal and newborn screening programmes, screening for clinical conditions such as gestational diabetes and pre-eclampsia, screening for infections, lifestyle advice, provision of care and management of pregnancy symptoms and breastfeeding.
[] Royal College of Paediatrics and Child Health, Why Children Die: death in infants, children and young people in the UK, May 2014
[] The Investigation and Management of the Small-for-Gestational-Age Fetus; Royal College of Obstetricians and Gynaecologists (Green-top guideline no. 31), March 2013