Infant mortality
Last Modified 21/07/2026 16:31:19
Share this page
Introduction
Infant mortality is an indicator of the general health of an entire population. It reflects the relationship between causes of infant mortality and upstream determinants of population health such as economic, social and environmental conditions. Deaths occurring during the first 28 days of life (the neonatal period) in particular, are considered to reflect the health and care of both mother and newborn.
In England, infant mortality has risen slightly for three consecutive years, with widening geographical, socioeconomic, and ethnic inequalities. Rates are more than double in the most deprived areas compared with the least deprived, and a third of all infant deaths occur in the 20% most deprived neighbourhoods of England.1
The Royal College of Paediatrics and Child Health report 'State of Child Health in the UK 2020' found that improvement in infant mortality has stalled in the UK and England since 2014 and progress has slowed compared to other European nations.2 While data classification issues may partially explain the change, social inequalities continue to have a marked impact on infant mortality.
There is no current UK government target to reduce overall infant mortality and the National Maternity Safety Ambition launched in 2015 has had several moving targets for reduction in stillbirths, neonatal deaths and maternal deaths. Looking ahead there is cause for concern as recent outbreaks of whooping cough and other infections in childhood may increase infant mortality in the coming years.3
Globally the Foreign, Commonwealth and Development Office (FCDO) published the ‘Ending the Preventable Deaths of Mothers, Babies and Children by 2030’ Approach Paper in 2021, setting out the UK’s commitment to working with others to end preventable maternal, newborn and child deaths. Since October 2024, this approach operates under the name of ‘Healthy Women, Children and Newborns (HWCN): A Coordinated Approach to Ending Preventable Deaths’.
Facts and figures
Blackpool experiences higher than average mortality rates for infants; however the actual number of deaths each year is small which means the rates are subject to large annual variation and need to be interpreted with caution.
In this case infants are defined as children under the age of one year. The data represents the crude rate of infant deaths per 1,000 live births, in Blackpool, the North West and England. The data in figures 1 and 2 are grouped into three-year periods to mitigate for the small number of deaths in a single year. The Blackpool infant mortality rate increased from the early 2000s to the mid 2000s, declined to 2010-12 before rising again to a relatively flat rate to 2014-16. After falling in 2018-20 rates have been increasing and are now significantly higher than the England average. In the last three-year period (2022-24) there were 33 infant deaths in Blackpool, a rate of 7.8 per 1,000 live births, compared to the England average of 4.3 per 1,000.
Figure 1: trend in infant mortality rates, 2011-13 to 2022-24 (per 1,000 live births)
| | 2011-13 | 2012-14 | 2013-15 | 2014-16 | 2015-17 | 2016-18 | 2017-19 | 2018-20 | 2019-21 | 2020-22 | 2021-23 | 2022-24 |
|---|
|
England
|
4.1
|
4.0
|
3.9
|
3.9
|
3.9
|
3.9
|
3.9
|
3.9
|
3.9
|
3.9
|
4.1
|
4.3
|
|
North West
|
4.4
|
4.3
|
4.2
|
4.5
|
4.6
|
4.6
|
4.5
|
4.3
|
4.4
|
4.4
|
4.6
|
4.6
|
|
Blackpool
|
5.2
|
5.3
|
6.5
|
5.4
|
6.4
|
6.0
|
6.4
|
5.4
|
6.0
|
5.9
|
6.9
|
7.8
|
|
Blackpool (number)
|
27
|
28
|
34
|
28
|
32
|
30
|
31
|
25
|
27
|
26
|
30
|
33
|
| Source: Office for Health Improvement and Disparities, Mortality Profile |
Figure 2: infant mortality trend, per 1,000 live births, 2001-03 to 2022-24 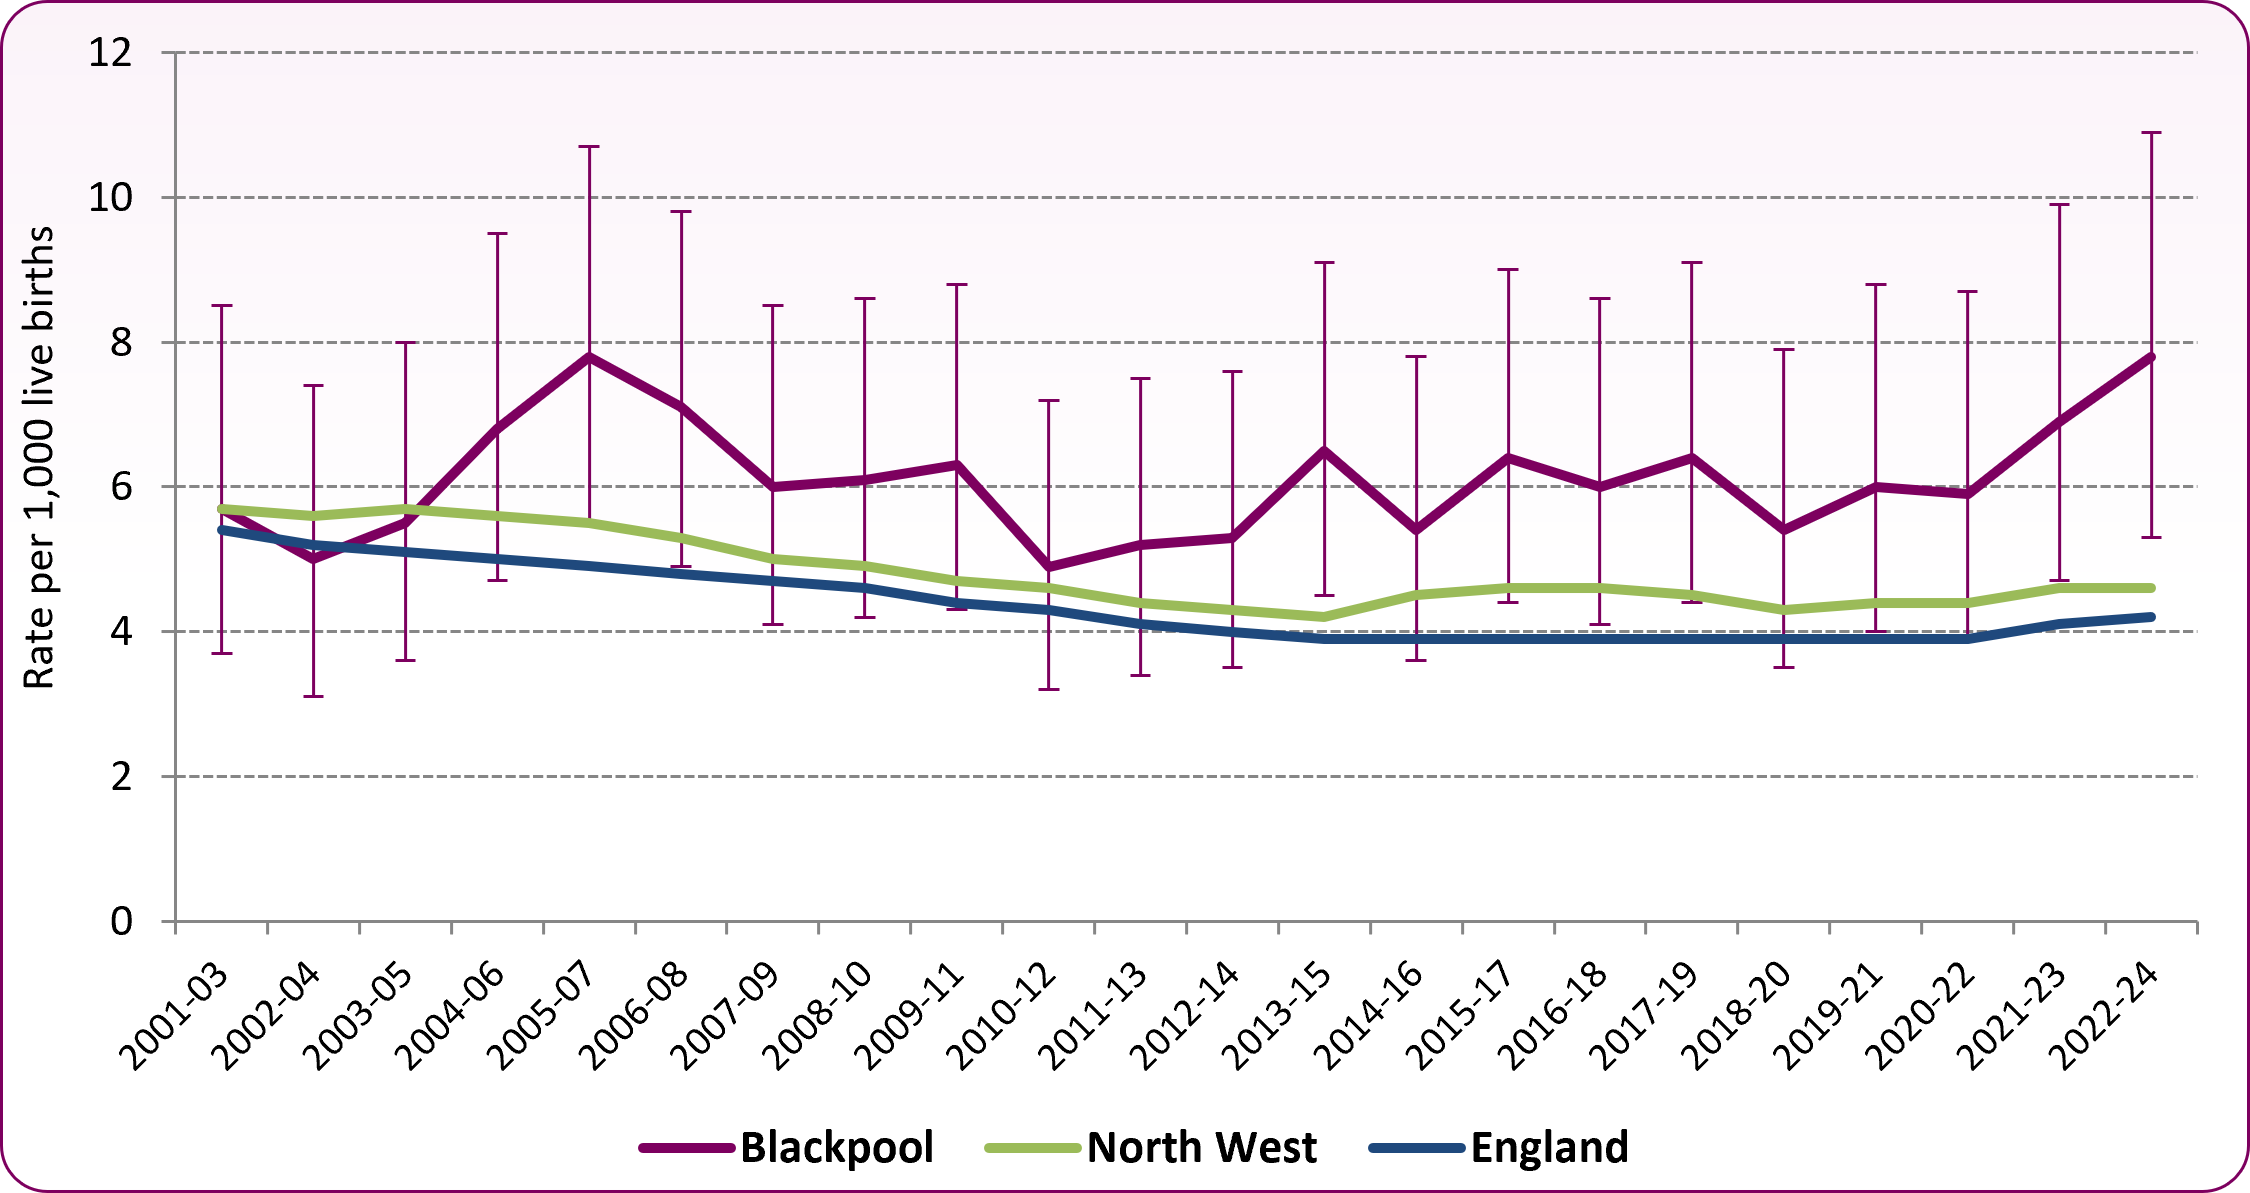 Source: OHID, Child and Maternal Health Profile
Figure 3 shows the infant mortality rate split by neonatal deaths (under 28 days) and post-neonatal deaths (between 28 days and one year). It can clearly be seen that deaths under 28 days make up the biggest proportion of infant mortality deaths in Blackpool and nationally, with Blackpool's neonatal mortality rate recently rising from 3.6 per 1,000 live births in 2018-20 to 5.6 in 2022-24. Blackpool's neonatal mortality rate is now significantly higher than the England average of 3.1 per 1,000 births.
Figure 3: trend in infant mortality by neonatal and post-neonatal mortality, Blackpool and England, 2010-12 to 2022-24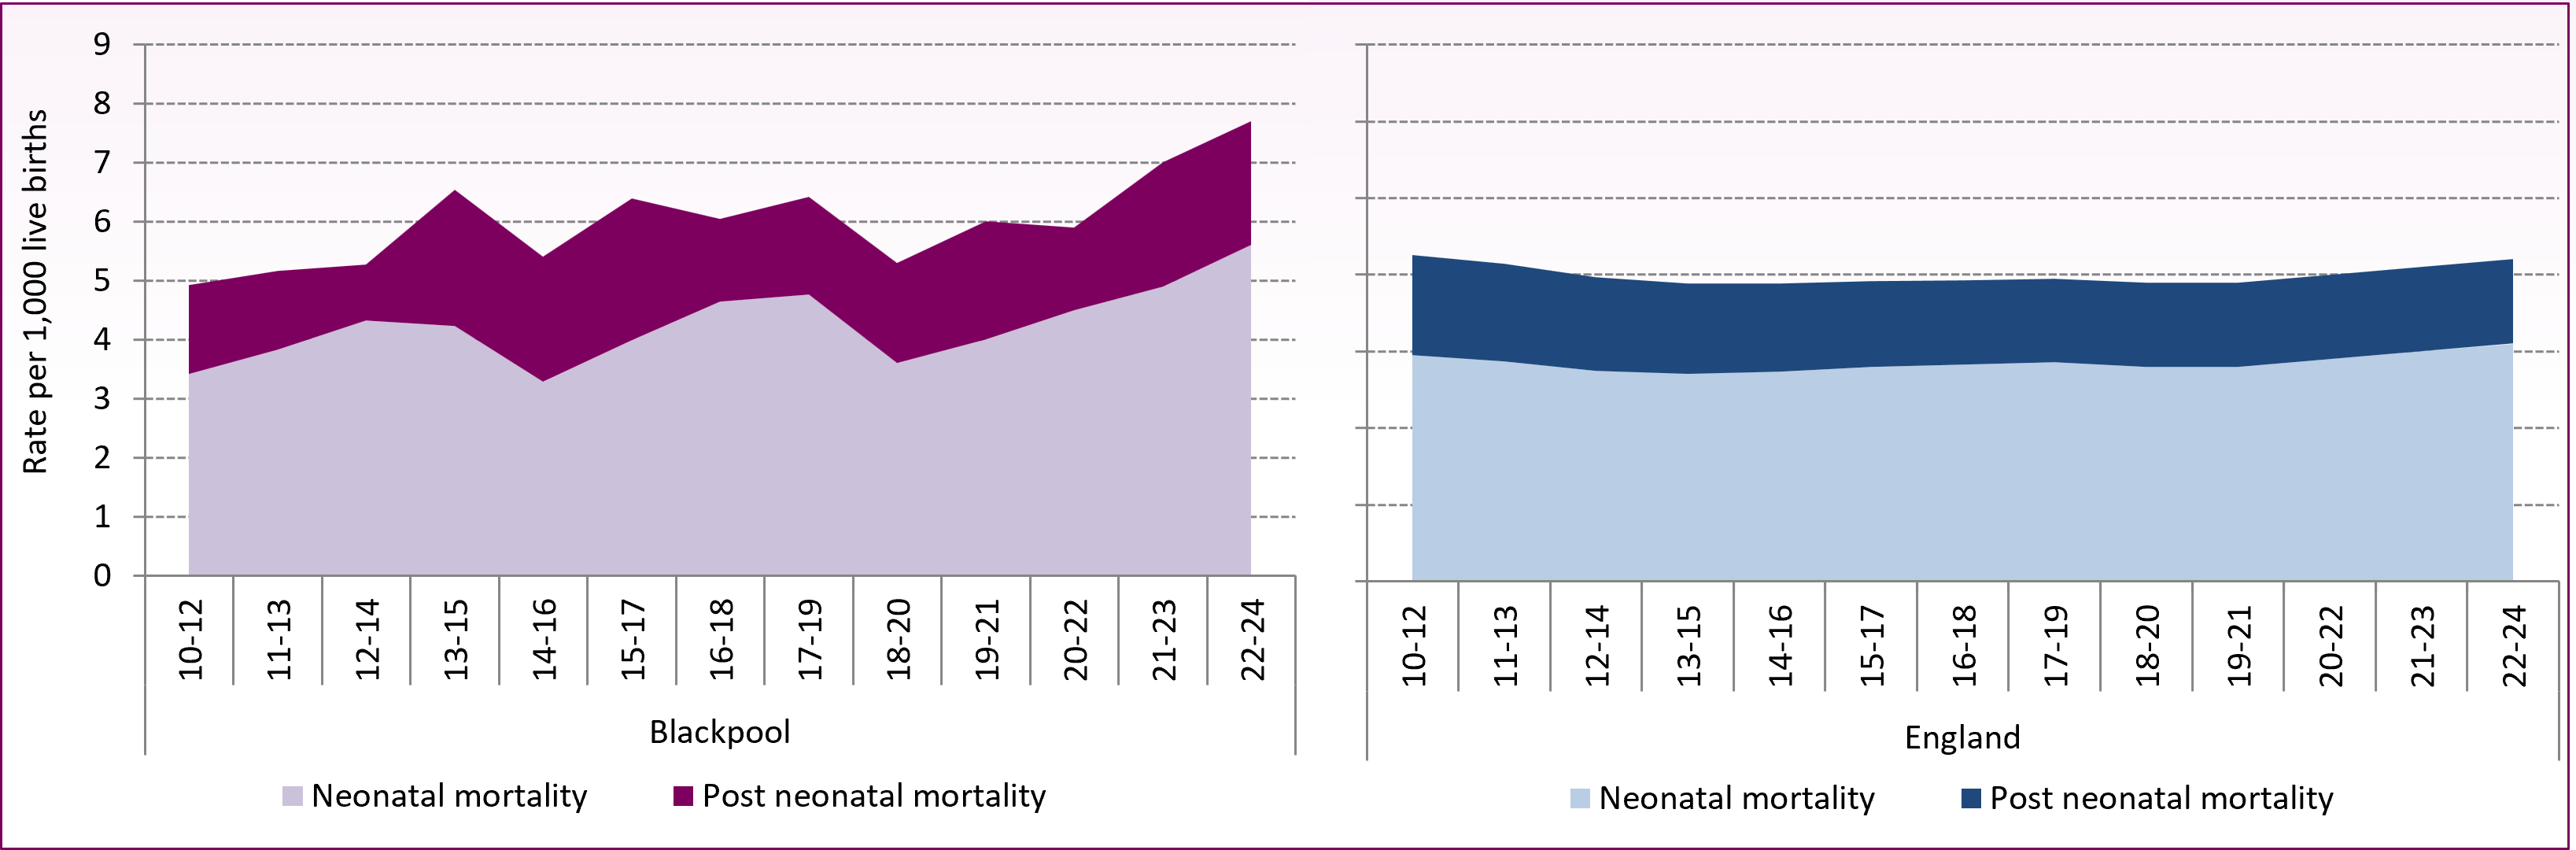 Source: OHID, Child and Maternal Health Profile
Over the past 40 years infant mortality rates in England and Wales have declined from 12 deaths per 1,000 births in 1980 to 3.9 in 2024, a likely reflection of advances in medical care, particularly midwifery and neonatal intensive care.
Neoplasms were the leading cause of death in 2024 among children aged 28 days to 15 years (17.3%), followed by congenital malformations, deformations and chromosomal abnormalities (17.2%). Immaturity-related conditions, such as respiratory and cardiovascular disorders, were the most common cause of neonatal deaths in 2024, alongside congenital anomalies and antepartum infections.4
Risk factors
Several different factors are associated with increased risk of infant death and these vary according to age at death. For example, the effect of prematurity and low birthweight is greater in the first 28 days. The Marmot Review: Fair Society, Healthy Lives in 2010 noted that factors, including births outside marriage, maternal age under 20 years and deprivation, were independently associated with an increased risk of infant mortality. In 2020, Health Equity in England: The Marmot Review 10 Years On found there had been increases in infant mortality in areas in the most deprived decile since 2010.
Risk factors for infant and child mortality include factors such as:
-
- Maternal age - younger mothers are more likely to have an infant/child die
- Parents who are closely related to each other
-
- Ethnicity
- Smoking or maternal substance misuse, including alcohol
- Poor maternal nutrition or obesity
- Social class and income deprivation
Additional medical factors also include:
-
- Maternal mental illness and stress
- Pre-existing medical conditions
- Low birth weights/gestational age
Child Death Overview Panel
In Blackpool, Lancashire and Blackburn with Darwen deaths of all children under the age of 18 are reviewed by the Child Death Overview Panel (CDOP) which is administered through the Lancashire Safeguarding Partnership. The main purpose of the panel is to identify lessons and prevent future child deaths. Their website has the most recent CDOP Reports.
National and local strategies
-
The Healthy child programme (Office for Health Improvement and Disparities, 2023) is current guidance to inform local implementation of the healthy child programme including preconception care and improving child health outcomes.
-
Inequalities in Infant Mortality Work Programme (National Perinatal Epidemiology Unit, 2020) - reviews of infant mortality in different topic area.
-
House of Commons Library, Research Briefing, Quality and safety of maternity care (England) (February 2025), details Government and NHS policies on the quality and safety of maternity care in England
-
The National Maternity Safety Ambition, launched in 2015, aimed to halve the 2010 rates of stillbirths, neonatal and maternal deaths and brain injuries occurring during or soon after birth by 2025. The latest statistics show that neonatal and maternal death rates appear unlikely to halve by 2025.
-
House of Commons Library, Research Briefing Infant mortality and health inequalities (Nov 2023) examines the progress to date in reducing infant mortality. It particularly focuses on persistent inequalities in infant mortality rates by geographical area, ethnicity and socio-economic group.
-
NHS England’s 3-year delivery plan for maternity and neonatal services (March 2023) sets out how the NHS will make maternity and neonatal care safer, more personalised, and more equitable for women, babies, and families.
-
NICE guidance [NG201] Antenatal care for routine pregnancies, 2021 covers the routine antenatal care that women and babies should receive
[] Pillay T, Dawson K, Trenell M. Infant mortality is rising in the UK—reducing modifiable risks can help reverse the trend, BMJ May 2025; 389 :r1053 doi:10.1136/bmj.r1053
[] The Royal College of Paediatrics and Child Health, State of child health in the UK, 2020
[] Akanni, Udu, Esan, Black et al. Infant mortality in England: August 2024. NHSA (2024). www.healthequitynorth.co.uk
[] ONS, Child and infant mortality in England and Wales: 2024, July 2026