Air Quality
Last Modified 17/12/2025 14:57:39
Share this page
Introduction
The quality of the air in an area can have important impacts on the health of the population living there. Air pollution in the form of chemicals and tiny particles (particulate matter) from vehicles, industry and agriculture has been shown to play a role in several health conditions including cancer, asthma, stroke and heart disease, diabetes, obesity and brain changes linked to dementia. It has also been shown that exposure to air pollution over a long period increases mortality risk. Air pollution has a bigger effect on the heath of the young and old, the sick and the poor.
Figure 1: The effects of air pollution
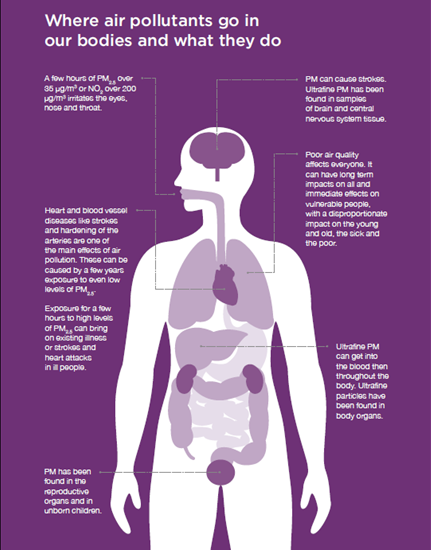 Source: LGA, Air quality: a briefing for directors of public health
The health issues that result from exposure to air pollution have a high cost to society, the economy and health services. It is estimated that these costs add up to more than £20 billion every year in the UK (figure 2).
What is air pollution?
The main pollutants that are known to harm health are oxides of nitrogen (NOx), particularly Nitrogen Dioxide (NO2) and particulate matter (PM). Other pollutants that can harm health include sulphur dioxide, ammonia, non-methane volatile organic compounds (NMVOCs) and ozone (O3).
NO2 is a gas that is found predominantly in diesel car/van exhaust fumes. It irritates lung linings and has both short- and long-term health impacts.
NO2 has been linked with increased hospital admissions for respiratory issues, adverse birth outcomes and increased mortality. There is also some evidence to suggest that NO2 may impact on cardiovascular-related mortality.
Long term exposure to NO2 is reported to have associations with respiratory and cardiovascular morbidity, children’s respiratory symptoms and lung function.
PM can be either released directly into the air or form through chemical reactions in the air. Sources are either natural (sea spray and sand/dust from rock erosion), or man-made (smoke, car exhaust fumes, industrial or agricultural waste or fumes).
PM is classified by the size of the particles in microns; PM10, PM2.5, PM0.1.
PM10 tends to have a more direct, short-term impact on people’s respiratory symptoms and health as it reaches the upper airways and can be cleared by mucous membranes unless they are impaired by diseases such as COPD or Asthma.
Evidence suggests that PM10 increases the:
-
- Post neonatal (1- 12 months) all-cause infant mortality (long-term exposure)
- Prevalence of bronchitis in children 6-12 years (long-term exposure)
- Incidence of chronic bronchitis in adults (long-term exposure)
- Incidence of asthma symptoms in children with asthma (short-term exposure)
The smaller particles (i.e. PM2.5 and PM0.1) have greater potential to impact long term health because of their ability to penetrate deeper into the lungs. PM2.5 can lead to high plaque deposits in arteries, which contribute to hardening of the arteries, which can lead to heart attacks and other cardiovascular problems. Ultrafine PM0.1 can get into the blood supply and travel throughout the body. Ultrafine particles have been found in body organs including brain and vascular tissues and are hypothesised to interact at a cellular level which may explain some of the less well understood health impacts of air pollution.
How bad is the problem?
National facts and figures
Nationally, outdoor air pollution has decreased considerably in recent decades, due to a combination of legislation and technological advances. Since 1970 sulphur dioxide emissions have decreased by 95%, particulate matter by 73%, and nitrogen oxides by 69%. Total UK emissions of nitrogen oxides fell by a further 19% between 2010 and 2015, however there are no safe levels of some pollutants.
A report by the Royal College of Physicians in February 2017 estimated that all forms of air pollution account for around 40,000 deaths annually with an associated annual social cost of £22.6 billion. Figure 2 shows a summary of the impacts of air pollution on health in the UK from a European cost-benefit analysis.
Figure 2: Summary of Cost-benefit Analysis for the EU Clean Air Package showing health impacts of Ozone and PM2.5, and associated monetised estimates (in euros) of impacts in the UK. The equivalent analyses were not done for NO2 or other pollutants
| | UK Health impacts of air pollution | Cost |
|---|
| | Units | Count | €million/year |
|---|
| Ozone effects |
|
|
|
| Mortality (valued as loss of life expectancy) |
Premature deaths |
1,371 |
61 - 146 |
| Hospital admissions |
- |
- |
7 |
| Respiratory admissions |
Cases |
1,368 |
- |
| Cardiovascular admissions |
Cases |
2,678 |
- |
| Minor restricted activity days |
Days |
6,662,683 |
215 |
| PM2.5 effects |
|
|
|
| Mortality (valued against life expectancy)* |
Life years lost |
327,769 |
14,600 - 34,600 |
| Mortality (valued against deaths)* |
Premature deaths |
30,018 |
25,400 - 51,500 |
| Infant mortality |
Premature deaths |
70 |
88 - 227 |
| Chronic bronchitis |
Cases |
25,582 |
1,055 |
| Bronchitis in children aged 6-12 |
Cases |
102,386 |
46 |
| Hospital admissions |
- |
- |
28 |
| Respiratory admissions |
Cases |
11,652 |
- |
| Cardiovascular hospital admissions |
Cases |
4,523 |
- |
| Restricted activity days |
Days |
40,809,466 |
2,888 |
| Asthma symptom days in children |
Days |
1,171,559 |
38 |
| Lost working days |
Days |
6,097,215 |
610 |
| Total cost |
- |
- |
€20,000 - €56,200 |
| *Alternative estimates of the same impact (effect of long-term exposure to particles on mortality) |
| Source: EMRC, Cost-benefit Analysis for the EU Clean Air Package |
Local facts and figures
Air quality in Blackpool is largely dominated by traffic emissions; the M55 terminates at the boundary of Blackpool, bringing traffic from the M6 efficiently into Blackpool. Large amounts of tourist traffic can often lead to congestion, particularly during the holiday seasons. The other main roads in Blackpool are the A583, A5073 and A5230 which lead off the M55, the A587 and the A584 which runs along the seafront.
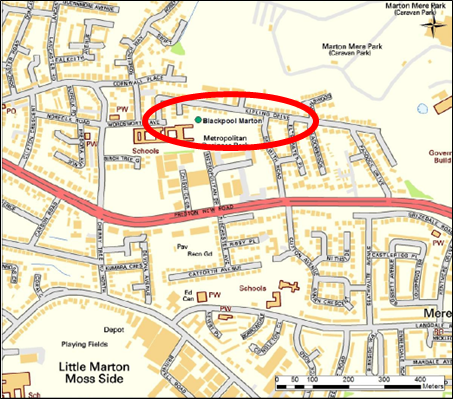
Blackpool has one monitoring station that reports data on levels of NOx and PM10 into the Automatic Urban and Rural Network (AURN). There are also other non-automated monitoring sites in the town to monitor NO2 concentrations across the borough.
Figure 3: The Blackpool Merton AURN monitoring site.
The World Health Organization (WHO) set guidelines to minimise the public health impact of air pollution while still being economically achievable. According to these guidelines, annual average levels of PM should not exceed
-
- 10 μg/m3 of PM2.5
- 20 μg/m3 of PM109
- 40 μg/m3 of nitrogen dioxide.
The WHO also acknowledges that there have been documented health harms resulting from lower levels of air pollution, particularly PM, for which there is no “safe” level.
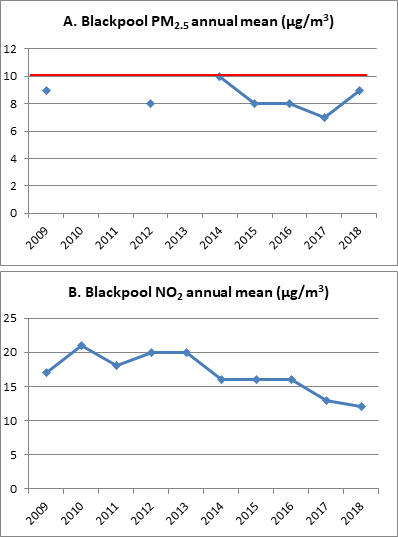
Background PM2.5 levels in the town recorded by the automated system have been close to but not exceeding the WHO guidelines (figure 4A).
Blackpool generally doesn’t exceed the NO2 levels for annual background (AURN monitoring) levels (figure 4B), but the non-automated network has recorded exceedances within the Air Quality Management area since 2005 (figure 6).
Figure 4: A-Blackpool average mean PM2.5 for the past 10 years. B-Blackpool average NO2 over the past 10 years. (Missing data points indicate no measurements available).
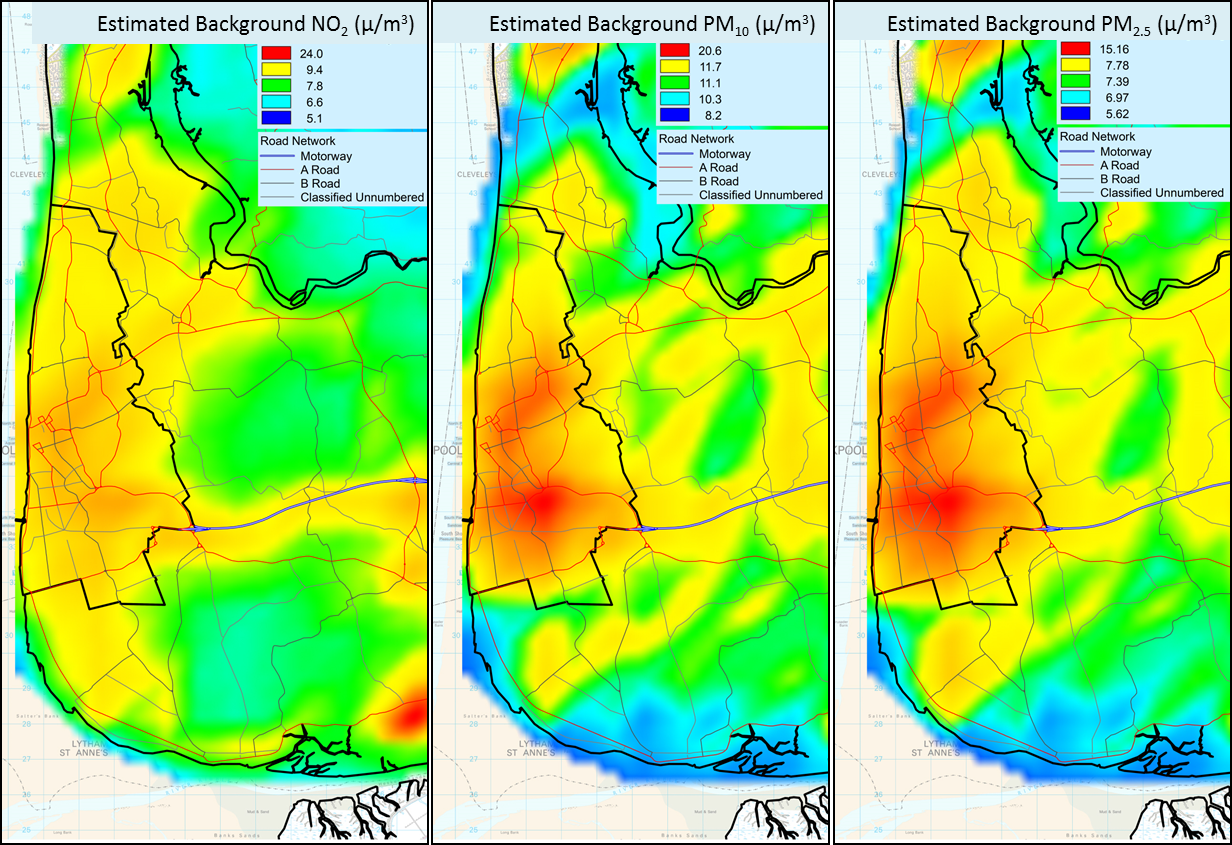
There are many models that assess how air quality may affect towns or local authority areas. The maps below (Figure 5) show the areas of the town that are likely to encounter highest levels of NO2, PM10 or PM2.5 pollution due to the contributions of different types of transport infrastructure, domestic and commercial heating, industry, rail and aircraft sources in the area. The colour scales on the maps are not linear; meaning moving from a yellow to a red area indicates a much bigger increase in pollutant concentration (approximately double) than moving from green to yellow.
The maps indicate two main areas that are likely to be affected by higher levels of pollution; around the Hawes Side area, and around Talbot Road/Queenstown area.
Figure 5: Modelled areas of higher background pollution in Blackpool based on 2015 measurements. (Gravimetric measurements of PM used)
As part of the Public Health Outcome Framework (PHOF), Public Health England (PHE) calculate the fraction of annual all-cause adult mortality attributable to anthropogenic (human-made) particulate air pollution (measured as fine particulate matter, PM2.5).
Approximately 4.3% of deaths amongst Blackpool residents are estimated to be attributable to poor air quality which equates to around 75 deaths each year (figure 6).
Figure 6: PHOF D01 - the fraction of population mortality thought to be due to air pollution in Blackpool (%)
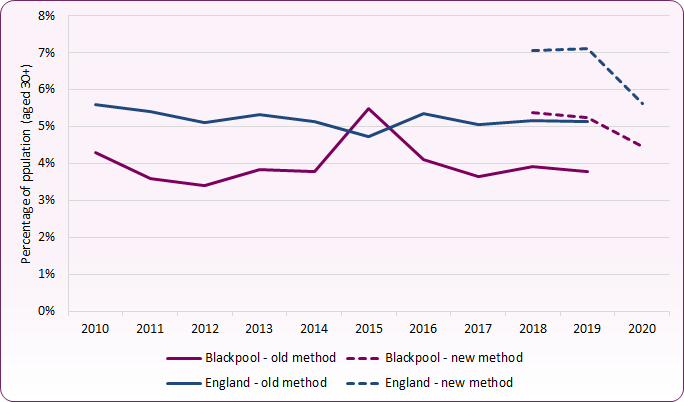 Source: Office for Health Improvement and Disparities (OHID), Public Health Profiles
Blackpool has higher-than-national-average rates of many diseases associated with poor air quality, including asthma (particularly in children), COPD, and cardiovascular disease. While we cannot be sure of the proportion of these cases are related to air pollution, we know air pollution combined with other risk factors such as poor quality or overcrowded housing and fuel poverty correlates with illness and lost years of life.
Health inequalities
The impacts of air pollution affect different groups of people in different ways. The DEFRA Briefing for Directors of Public Health notes that:
-
- The greatest burden of air pollution often falls on the most deprived communities and the most vulnerable individuals.
- It is often (though not always) the most deprived communities that live closest to the busiest roads, therefore increasing their exposure to air pollution.
Health effects of air pollution may be worse for people in deprived areas due to higher rates of existing cardiovascular and lung diseases, and interacting impacts of wider determinants of health (e.g. housing, employment).
The Marmot Review notes that individuals in deprived areas experience more adverse health effects at the same level of exposure compared to those from less deprived areas, however it also shows that universal actions to tackle air pollution can disproportionately benefit those in deprived areas. For example, although the London Congestion Charge was a population-wide intervention, it is areas of highest deprivation within the charging zone that have seen the biggest reductions in levels of NO2 and PM10.
What is being done to reduce air pollution?
Councils have statutory responsibilities under the Environment Act 1995 for Local Air Quality Management (LAQM). Local authorities must monitor, assess and take action to improve local air quality. Where a local authority identifies areas of non-compliance with the nationally set air quality objectives, and there is relevant public exposure, council must declare an Air Quality Management Area (AQMA) and to draw up an action plan detailing remedial measures to address the problem.
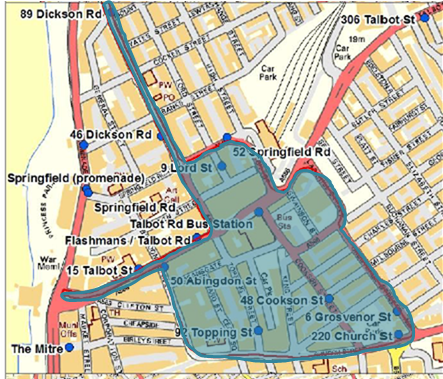
Blackpool Council has one AQMA which is located around central Blackpool (figure 7) that has been in place since 2005. This means that in this area, NO2 levels exceed the stipulated limits on occasion and individuals may be exposed to levels of air pollution that are harmful. The air quality progress reports published by the council can be found here.
Figure 7: The AQMA in central Blackpool - Blue dots indicate the location of NO2 monitoring sites (as of 2014)
National initiatives
In 2019 the UK Government published its Clean Air Strategy, which sets out the actions required across all parts of government and society to cut public exposure to particulate matter pollution, as recommended by the World Health Organisation. The strategy renews existing plans to reduce transport emissions by banning sales of conventional cars and vans by 2040, in favour of electric vehicles; phasing out diesel-powered trains by 2040, and creating strategies to reduce port- and aviation-related emissions. New legislation to control use of polluting fuels in commercial settings and homes is being rolled out, and guidelines are planned to reduce volatile organic compounds in consumer products. The government also intends to further regulate and reduce emissions from farming and industry.
The strategy is supported by the Environment Act 2021 which operates as a post-Brexit framework of environmental protection, and includes powers to set new binding targets for air quality, as well as for water, biodiversity and waste reduction. The Act also strengthens local powers in relation to air quality enforcement.
Local initiatives
The Air Quality Action Plan outlines the action Blackpool Council will take to improve air quality in Blackpool between 2023 and 2028.
Encouraging greener travel
Expansion of the tram network – The council has invested in expansion of the tram network to extend it to connect with the rail network at Blackpool North Station. Services are expected to run from 2019.
Cycle for Health is an initiative that encourages people to try cycling and provides the opportunity to try out bikes adapted to those less confident or less able.
A taxi company in the town has a fleet of electric vehicles meaning journeys within the town create zero emissions.
Living Streets are a charity organisation that encourages people to walk more, including encouraging children to walk to school.
Green Infrastructure
The Blackpool Local plan 2016-2027 includes a core policy to protect, enhance, and create new green infrastructure in the town. Urban trees and plants can filter pollutants, reducing airborne PM and thus improving air quality. There are also clear links between green infrastructure and the health and well-being of communities.
What more can be done about air pollution in Blackpool?
Air quality is an important public health issue, but it interacts with other priority issues so tackling air quality could improve more than just the air we breathe.
For instance, as well as reducing emissions, encouragement of active travel will have wider public health benefits including improving mental wellbeing and reducing excess weight at various ages. These co-benefits will maximise the returns-on investment and viability of any proposed interventions.
The government have announced a fund of over £40 million to support local authorities to improve their air quality. Projects that have benefited from governmental air quality grants have included
- Updating local transport infrastructure to include electric vehicle charging points and converting bus fleets to electric
- Awareness campaigns in schools and community on transport and domestic burning stoves
- Community action plans to secure business engagement on emissions from industry and transport.
Figure 8: Powers that local authorities can use to improve air quality
| Transportation | Other |
|---|
| Traffic and parking management |
Planning |
| Street design and road layouts |
Building energy efficiency |
| Restricting access to the dirtiest vehicles |
Permitting and regulation of certain types of industrial processes, factories and other activities that can cause pollution (environmental permitting) |
| Public and school transport policies |
| Idling of vehicles (including school exclusion zones and traffic light phasing) |
Location and enforcement of smoke control areas (SCAs) |
| Favouring clean vehicle fuels like petrol, LPG or CNG over diesel and bio-diesel |
|
| Freight consolidation, delivery management and low or zero emission last mile services |
|
| Fleet management and car clubs |
|
| Installation and maintenance of electric vehicle charging points |
|
| Vehicle and building air conditioning |
|
The Lancashire and Cumbria Directors of Public Health report on Air Quality suggests that the following actions could be taken to improve air quality:
- Identify Elected Member and officer Air Quality Champions
- Inclusion of air quality in strategic plans including Health and Wellbeing Strategy, Physical Activity Strategy, transport and economic plans
- Adopt a common set of principles/guidance for planning policy
- Collaborate across Lancashire and Cumbria to develop best practice in relation to green infrastructure including green barrier projects
- Promoting and enabling ‘mode shift’ to decrease reliance on cars and increase the use of public transport and active travel (cycling and walking)
- Promoting and facilitating the use electric vehicles by public transport operators and public authorities
- Facilitating the take up of electric vehicles by the public, and developing the EV charging infrastructure
- ‘No idling’ zones around schools
- Public awareness and engagement to communicate information about local air quality and promote understanding of the health effects, how they can reduce air pollution and how they can protect themselves
- Considering any need for action locally on non-transport pollution sources