Road Safety
Last Modified 27/03/2023 14:37:11
Share this page
Introduction
Road safety remains very important to Blackpool Council. Since becoming a unitary authority in 1998 the numbers of people killed and injured on local roads has reduced, however there is still some work to be done to make Blackpool's roads safer for everyone.
Blackpool's children are particularly vulnerable in the road environment, especially those who come from areas of disadvantage, and a considerable amount of resource needs to be allocated to educating drivers, children and their parents.
In order to improve the health and wellbeing of Blackpool's population, and to reduce congestion and pollution, various activities are taking place to encourage more walking and cycling whilst learning to share the space that is available to all. It is important though that by doing this people receive relevant information and training to reduce their vulnerability in the road environment.
Facts, figures and trends
The numbers of casualties on Blackpool's roads varies from year to year. Figure 1 shows road casualty trends for Blackpool between 2010 and 2020. This data is based on police reported data, and since there is no legal obligation to report a road traffic collision, there is a risk of under-reporting. There are also variations in measuring the severity of casualties across police forces, with Lancashire Constabulary moving to a new recording system in 2018. Figure 1 reports both the number of serious injuries reported locally and a nationally adjusted estimate by the Department for Transport. The adjusted estimate is a more reliable measure of trends over time for those seriously injured1,2. Between 2010 and 2019, estimated annual motor vehicle traffic levels in Blackpool rose from 341 million vehicle miles to 417 million vehicle miles per year (falling to 347.5 per million in Covid-19 affected 2020).
Whilst the overall number of casualties demonstrates a generally downward trend, this is less apparent in the numbers of those who are seriously injured. The 2019 rate of people killed or seriously injured in Blackpool was 254.2 per billion vehicle miles, compared to an estimated 84.8 in England and 80.7 in the North West. This was the highest rate outside London. Whilst reduced, Blackpool's 2020 rate of 146.6 per billion vehicle miles is still significantly higher than the England rate of 86.13.
2020 figures are affected by Covid-19 restrictions. At the start of the lockdown period in April 2020 national road casualties saw a monthly percentage decrease of 68% compared to the 3-year average for 2017-19. This was aligned to the reduction in motor traffic over this period. However, nationally, pedal cyclist fatalities aligned with pedal cycling traffic, which increased during the first lockdown4.
Having originally adopted targets for a reduction in road traffic causalities by 2010, directed by the government in 2000, these were met by 2004. The involvement of Blackpool Council with Lancashire Partnership for Road Safety, the introduction of speed cameras at casualty hotspots in 2002, and the launching of the 'Blackpool is 30 or less' campaign in 2003 made a considerable contribution to the reduction in casualties.
Figure 1 - Road Traffic Casualties in Blackpool 2010-20
| Road Traffic Casualties | 2010 | 2011 | 2012 | 2013 | 2014 | 2015 | 2016 | 2017 | 2018 | 2019 | 2020 |
|---|
| Fatal |
4 |
1 |
2 |
4 |
0 |
1 |
2 |
2 |
2 |
0 |
0 |
|---|
| Seriously Injured* |
61 |
71 |
52 |
69 |
51 |
58 |
83 |
61 |
70 |
106 |
51 |
|---|
| Seriously Injured (adjusted) |
117 |
123 |
108 |
121 |
105 |
108 |
134 |
108 |
112 |
106 |
51 |
|---|
| All Casualties |
692 |
588 |
619 |
582 |
560 |
502 |
563 |
511 |
452 |
396 |
308 |
|---|
Source: Department for Transport, Data Download Tool, https://roadtraffic.dft.gov.uk/custom-downloads/road-accidents.* changes to seriously injured reporting systems (in 2018) means that caution is needed when comparing trend data.
Children
In 2002, Blackpool was informed by the Department for Transport (DfT) that the town had the highest rate for child casualties in the country, compared to the numbers of children resident in the town. Research shows that the incidence of being involved in road traffic collisions is highest in areas of disadvantage and deprivation. In 2001 there were 153 casualties aged 0 to 15 years in Blackpool, with one fatality and 23 serious injuries. As a result Blackpool Council placed an emphasis on delivering road safety education to the young people of Blackpool, especially the most vulnerable. It is felt that measures introduced were effective, as shown in the lower numbers of casualties in more recent years. Figure 2 shows the number of road traffic casualties for children (aged 0-15) in Blackpool between 2013 and 2020.
Figure 2 - Blackpool Child Road Traffic Casualties (age 0-15): 2013-2020
| Child (0-15 years) Casualties | 2013 | 2014 | 2015 | 2016 | 2017 | 2018 | 2019 | 2020 |
|---|
| Fatal |
0 |
0 |
0 |
0 |
0 |
0 |
0 |
0 |
|---|
| Seriously Injured* |
10 |
9 |
9 |
12 |
10 |
11 |
16 |
9 |
|---|
| Seriously Injured (adjusted) |
14 |
16 |
16 |
14 |
14 |
14 |
16 |
14 |
|---|
| All Casualties |
80 |
73 |
57 |
67 |
72 |
64 |
68 |
40 |
|---|
Source: Department for Transport, Data Download Tool, https://roadtraffic.dft.gov.uk/custom-downloads/road-accidents.
As the number of child casualties in some areas is small, comparative trends are drawn from 3-year rolling figures, reducing the impact of year-on-year fluctuations. Figure 3 shows 3-year rate trends for children killed or seriously injured on roads in Blackpool, the North West and England since 2008. Whilst rates for England and the North West have declined, Blackpool's rate for children killed or seriously injured on the road rose from 30.1 per 100,000 between 2012 and 2014 to 47.5 per 100,000 between 2017 and 2019. The current rate of 46 per 100,000 is the third highest in the country and almost three times the England rate of 15.9. All age groups under 16 have rates significantly higher than the England average, and the rate for those aged 6 to 10 years of 55.9 per 100,000 (compared to 12.2 for England) is the highest rate in the country.
Figure 3: Children Killed or Seriously Injured on Roads: Blackpool, North West and England (adjusted and unadjusted figures), 2008/12 to 2018/20 (3-year rolling average)
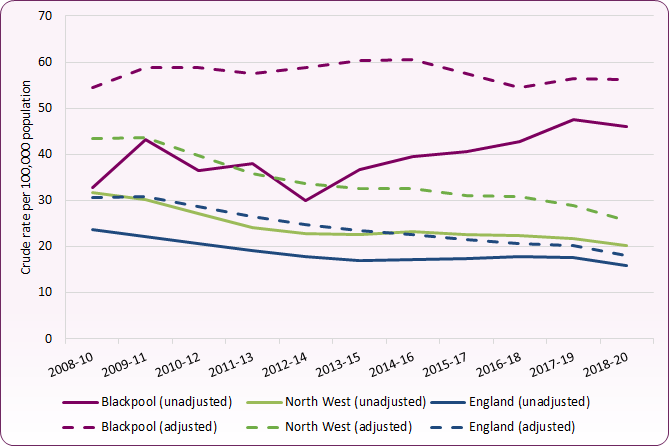 Source: Department for Transport, Data Download Tool, https://roadtraffic.dft.gov.uk/custom-downloads/road-accidents. NOTE: Due to serious injury reporting system changes, unadjusted trend data is less reliable. Unadjusted data from 2018 onwards is likely to reflect this shift in recording (towards greater alignment with adjusted figures).
Road User Types
Analysis of casualty statistics is regularly undertaken to analyse any patterns, understand road user behaviour, identify groups who are particularly at risk, and plan responses accordingly. Figure 4a (2019) and Figure 4b (2020) show casualties by severity and road user type, highlighting the vulnerability of non-car users. For the period 2016-2020, Blackpool had the highest overall rate in the country of pedestrians aged 0 to 24 killed or seriously injured in road traffic accidents (24 per 100,000 compared to 10 per 100,000 across England). Rates for 0 to 24 year old pedal cyclists and 15 to 24 year old motorcyclists killed or seriously injured are also significantly higher than the England rate, though the rate for 15 to 24 year old car occupants is slightly lower.
Analysis of 2019 and 2020 casualty data suggests that though there is a slight increase in summer casualties (particularly in August), road traffic casualties are distributed throughout the year. Afternoon and early evening (between 1pm and 7pm) are the most common times for road accidents to occur. In 2019, 60% of all casualties were male (55% in 2020). For those aged 0 to 24, 66% of casualties were male.
Figure 4a - Road Traffic Casualties - 2019 by Road User Type
| Road Traffic Casualties | Pedestrian | Pedal cycle | Motor Cycle | Car | Bus or Coach | Van | HGV | Other |
|---|
| Fatal |
0 |
0 |
0 |
0 |
0 |
0 |
0 |
0 |
|---|
| Seriously Injured |
40 |
10 |
16 |
37 |
1 |
0 |
0 |
2 |
|---|
| All Casualties |
97 |
36 |
35 |
217 |
5 |
2 |
0 |
4 |
|---|
Figure 4b - Road Traffic Casualties - 2020 (Covid-19 affected) by Road User Type
| Road Traffic Casualties | Pedestrian | Pedal cycle | Motor Cycle | Car | Bus or Coach | Van | HGV | Other |
|---|
| Fatal |
0 |
0 |
0 |
0 |
0 |
0 |
0 |
0 |
|---|
| Seriously Injured |
10 |
10 |
9 |
20 |
0 |
1 |
0 |
1 |
|---|
| All Casualties |
52 |
37 |
25 |
184 |
0 |
6 |
0 |
4 |
|---|
Source: Department for Transport, Data Download Tool, https://roadtraffic.dft.gov.uk/custom-downloads/road-accidents.
Although the number and rate of road traffic casualties in Blackpool has declined from high levels in the early 2000s, rates remain higher than many areas across the country. Figure 5 compares the rate of casualties per head of population in Blackpool with the North West and England.
Figure 5: Reported casualty rate per 100,000 population, 2020
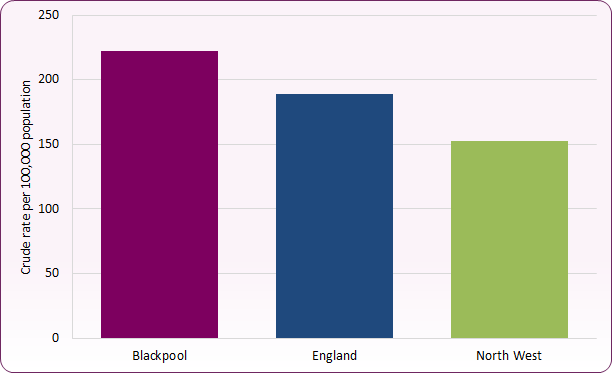 Source: Department for Transport, Data Download Tool, https://roadtraffic.dft.gov.uk/custom-downloads/road-accidents.
The overall objective for road safety is to continue to reduce the numbers of people killed and injured on Blackpool's roads; working towards making our roads amongst the safest in the country.
National and local strategies
- Strategic framework for road safety (Department for Transport, 2013) - The UK government's approach to continuing to reduce killed and seriously injured casualties on Britain's roads.
- Road Safety Statement 2019: a lifetime of road safety (Department of Transport, 2019) - Road safety statement and two-year action plan, addressing road safety issues throughout the lifetime of road users. The plan focuses on:
- young road users: developing road safety skills and knowledge
- young adults: improving the awareness and skills of young drivers (and passengers)
- adults: continued skills improvement and staying legal and safe on the road
- third-age adults: supporting older people to maintain skills and confidence required to stay safe.
[] Department for Transport, Reported Road Casualties in Great Britain: guide to the statistics and data sources, v1.1, 7 November 2013.
[] Department for Transport, Guidance: Guide to severity adjustments for reported road casualties Great Britain, 13th October 2021.
[] Office for Health Improvement & Disparities, Public Health Profiles: Killed or seriously injured (KSI) casualties on England's roads, 2020 (source data: Department of Transport).
[] Department for Transport, The impact of lockdown on reported road casualties Great Britain, final results: 2020, 30 Sept 2021.