Community insight
Last Modified 17/12/2025 16:00:01
Share this page
Introduction
The Community Life Survey is a national biennial survey and a key evidence source for understanding more about our residents. It presents their views around community engagement, cohesion, wellbeing and connectedness, loneliness, and satisfaction with the local area, among other topics.
The questionnaire has included some new questions and has seen changes to existing questions. For the first time, local authority data are now included in the survey results, which means we can monitor the trends and shifts in opinions across Blackpool’s resident population if these findings are subsequently produced.
Comparisons of this year’s 2023/24 results are made against the results from previous survey, where available. It should be noted that fieldwork for 2020/21 and 2021/22 (particularly during the first quarter of the 2021/22 survey), took place during the COVID-19 pandemic. It is unclear what effect the COVID-19 pandemic, associated lockdown measures and associated media coverage may have had on relevant public behaviours, attitudes and perceptions. This should be taken into consideration when interpreting comparisons from these years to results from 2023/24.
This page presents some of the key findings, with further details available in the Blackpool summaries at the bottom of the page. All charts and tables are from the survey findings.
Facts and figures
Where available, Blackpool’s proportions are provided, where they are not the England proportions are applied to the relevant local population (aged 16 and over) and a count for Blackpool is produced. Please note, this may result in an under- or over-estimate of the count for Blackpool and while not exact can be useful, along with other local intelligence, to get a picture of life for our residents.
Loneliness and support networks
The harms to health from loneliness and social isolation are established, associated with increased risk of cardiovascular disease, hypertension, diabetes, infectious diseases, impaired cognitive function, depression, and anxiety.[i]
In Blackpool 12,355 residents feel lonely ‘often’ or ‘always’, significantly higher than England, the North West and Lancashire. There has been a one percentage point increase from the 2021/22 survey in the England proportion who state they are lonely ‘often’ or ‘always’.
Figure 1: proportion of people who are lonely 'often' or 'always' (2023/24)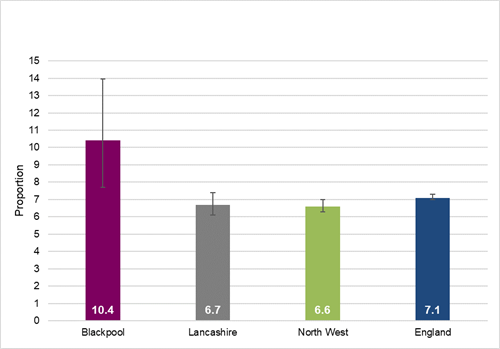
Looking at the demographic breakdown, there is a higher proportion of females (7.6%, 4,539) who are lonely ‘always’ or ‘often’ compared to males (6.5%, 3,798). By age breakdown, the younger age groups have higher rates of feeling lonely ‘often’ or ‘always’. The last column indicates the direction of change from the 2021/22 survey (for England).
Table 1: England’s proportion of feeling lonely ‘often’ or ‘always’ applied to Blackpool’s population by age group
Proportion of adults lonely 'often' or 'always' by age breakdown
| Age group | Proportion % | Count | Change |
|---|
|
16-24
|
9.8
|
1,339
|
None
|
|
25-34
|
9.0
|
1,639
|
None
|
|
35-49
|
7.6
|
1,979
|
Increase
|
|
50-64
|
5.9
|
1,809
|
None
|
|
65-74
|
3.9
|
598
|
None
|
|
75+
|
5.8
|
859
|
None
|
Those living in the most deprived areas are more likely to be lonely ‘often’ or ‘always’, with 21.5% of those in deciles 1-2 (where 1 is the most deprived area). This equates to almost 7,200 residents in Blackpool. Blackpool has more areas in the more deprived deciles, the counts will also be higher. It should also be noted that Blackpool does not have any areas in deciles 8 to 10.*
Those who stated they felt lonely ‘often’ or ‘always’ rated their feelings around four measures: life satisfaction, life is worthwhile, happiness, and anxiety. They were more likely to rate as ‘low’ their life satisfaction, life is worthwhile, and happiness, while anxiety was rated medium or high. The change against the 2021/22 survey is also provided.
Table 2: those who are lonely 'often' or 'always' rating their feelings against four life measures (England proportion and Blackpool count)
| Measure | Rating | Change | Proportion | Count |
|---|
|
Life satisfaction
|
Low
|
No change
|
31.6
|
3,907
|
|
Life satisfaction
|
Medium
|
Increase
|
8.9
|
1,095
|
|
Life satisfaction
|
High
|
No change
|
2.0
|
253
|
|
Life satisfaction
|
Very high
|
No change
|
1.2
|
145
|
|
Life worthwhile
|
Low
|
No change
|
33.0
|
4,076
|
|
Life worthwhile
|
Medium
|
No change
|
9.1
|
1,126
|
|
Life worthwhile
|
High
|
No change
|
2.4
|
297
|
|
Life worthwhile
|
Very high
|
No change
|
1.5
|
191
|
|
Happiness
|
Low
|
No change
|
28.5
|
3,526
|
|
Happiness
|
Medium
|
No change
|
7.6
|
934
|
|
Happiness
|
High
|
No change
|
2.1
|
263
|
|
Happiness
|
Very high
|
No change
|
1.2
|
147
|
|
Anxiety
|
High
|
No change
|
12.4
|
1,538
|
|
Anxiety
|
Medium
|
No change
|
6.6
|
821
|
|
Anxiety
|
Low
|
No change
|
4.7
|
578
|
|
Anxiety
|
Very low
|
Increase
|
2.7
|
333
|
Note: the values across the four measures are not cumulative and estimates may be an under- or over-count
Additional questions - help, company and support
-
If I needed help there would be people there for me
-
If I needed company there would be people I could call on
-
If I needed to talk there would be one or more people who would listen
The responses to questions 1 and 2 are for those who answered ‘definitely agree’ or ‘tend to agree’, while for question 3 it was for those who answered ‘one person’ or ‘more than one person’. Table 3 has Blackpool’s proportion applied to its resident population (aged 16 and over) and is compared to England, Lancashire and the North West (no counts provided) and significance to these areas. Tables 4 and 5 use England’s proportion and these are applied to the Blackpool population to produce an estimated count.
The tables below show the responses to the three questions by local authority, age and sex, and deprivation.
Table 3: proportion and count for each question (England proportion and Blackpool count)
| Measure | Help (def / tend to agree) | Company (def / tend to agree) | Listen (one or more person) |
|---|
|
Area
|
Proportion
|
Count/significance
|
Proportion
|
Count/significance
|
Proportion
|
Count/significance
|
|
Blackpool
|
89.8
|
106,479
|
85.8
|
101,736
|
86.8
|
102,921
|
|
Lancashire
|
95.1
|
No difference
|
91.7
|
No difference
|
95.1
|
Lower
|
|
North West
|
94.9
|
No difference
|
92.0
|
No difference
|
95.6
|
Lower
|
|
England
|
94.4
|
No difference
|
91.8
|
No difference
|
95.4
|
Lower
|
Almost nine out of 10 people in Blackpool agreed there would be someone to help them if needed, and is not significantly different to England, Lancashire and the North West. Just under 86% agreed there are people available if they want company or want to socialise, again statistically similar to England, Lancashire and the North West. In response to the question ‘If I needed to talk, there would be one or more people who would listen’, Blackpool is significantly lower than England, Lancashire and the North West.
Table 4: age/sex breakdown by measure (England %, Blackpool count)
| Age | Help | Company | Listen |
|---|
| 16-24 |
94.0% (12,814)
|
92.5% (12,618)
|
95.8% (13,065)
|
|---|
| 25-34 |
93.6% (17,015)
|
91.0% (16,551)
|
95.3% (17,336)
|
|---|
| 35-49 |
93.5% (24,214)
|
90.7% (23,485)
|
95.3% (24,682)
|
|---|
| 50-64 |
94.4% (29,123)
|
91.6% (28,269)
|
94.4% (29,144)
|
|---|
| 65-74 |
96.0% (14,645)
|
93.6% (14,278)
|
95.8% (14,606)
|
|---|
| 75+ |
97.2% (14,321)
|
94.2% (13,876)
|
97.1% (14,316)
|
|---|
| Female |
95.5% (57,185)
|
93.1% (55,771)
|
96.3% (57,671)
|
|---|
| Male |
93.5% (54,867)
|
90.7% (53,254)
|
94.4% (55,415)
|
|---|
Table 5: deprivation decile breakdown by measure (England %, Blackpool count)*
| Decile | Help | Company | Listen |
|---|
| 1 (most deprived) |
92.0% (43,232)
|
88.4% (12,618)
|
92.5% (43,500)
|
|---|
| 2 |
92.2% (17,549)
|
89.3% (16,551)
|
93.8% (17,852)
|
|---|
| 3 |
93.0% (19,113)
|
90.8% (23,485)
|
94.4% (19,390)
|
|---|
| 4 |
93.6% (17,046)
|
91.0% (28,269)
|
95.2% (17,327)
|
|---|
| 5 |
93.6% (6,312)
|
91.1% (14,278)
|
95.2% (6,419)
|
|---|
| 6 |
94.8% (1,210)
|
92.3% (13,876)
|
95.8% (1,223)
|
|---|
| 7 |
95.7% (3,600)
|
93.2% (55,771)
|
96.3% (3,623)
|
|---|
| 8 |
96.2% (0)
|
93.8% (0)
|
96.5% (0)
|
|---|
| 9 |
96.1% (0)
|
94.0% (0)
|
96.7% (0)
|
|---|
| 10 (least deprived) |
97.0% (0)
|
94.6% (0)
|
97.4% (0)
|
|---|
Note: Blackpool does not have any LSOA in deciles 8 - 10, so no count is provided
Neighbourhood and community
Understanding how people, neighbourhoods and communities are connected is key. This section looks at how well individuals feel they belong to an area, how they perceive/trust others - particularly those from different backgrounds - and the perception of having a voice and being heard and being able to influence decisions in a local area. Building meaningful connections can support an individual’s health and wellbeing and improve community ties and connectedness. People at risk of exclusion include older people, those living alone, young adults facing social transitions, immigrants and other vulnerable individuals.
This is significant, as issues such as immigration, accommodation of people, and beliefs around different groups of people, continue to be concerns for many, with recent events showing increasing divides between communities.
Importance of belonging
A strong sense of belonging is crucial for both mental and physical health, as it fosters emotional wellbeing, resilience, and overall quality of life.
Mental health benefits: a sense of belonging is linked to lower rates of depression and anxiety. Research indicates that individuals who feel connected to others experience better emotional health and resilience, especially during challenging times.
Physical health implications: belonging is not just a psychological need; it also has tangible effects on physical health, with studies showing that social connections can enhance immune function and reduce stress levels – critical for maintaining overall health. The effects of loneliness have already been outlined.
Evolutionary perspective: the need to belong is rooted in our evolutionary history, as humans are social creatures who thrive in groups and rely on shared resources and mutual protection. This evolutionary background shapes individual's psychological need for connection, making belonging essential for survival and wellbeing.
Figure 2: proportion of people who feel they 'very' or 'fairly' strongly belong to their neighbourhood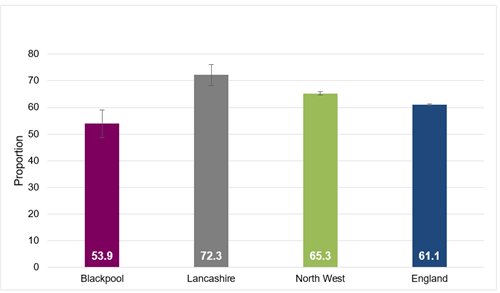
A ‘very’ or ‘fairly' strong feeling of belonging in Blackpool is significantly lower than England, the North West and Lancashire, and is the lowest in the Lancashire area. This equates to approximately 63,900 residents. For comparison, Ribble Valley (77.5%) is the highest. There have been no significant changes from the 2021/22 survey in response to this question nationally.
Older age groups are more likely to have a very/fairly strong sense of belonging, with the highest proportion for those aged 75 and over (72.5%, 10,689), compared with those 16-24 (53.9%, 7,345). All age groups show no change, apart from 35-49-years, which has increased.
Those in the most deprived areas are less likely to have a strong sense of belonging 53.5% in decile 1 (25,172 residents) compared to 65.2% in decile 7 (2,454).
Additional questions:
1) People from different backgrounds get on well together
2) People pull together to improve the area
3) People in the neighbourhood can be trusted
The responses to questions 1 and 2 are for those who answered ‘definitely agree’ or ‘tend to agree’, while for question 3 it was for those who answered ‘many people’. Table 6 has Blackpool’s proportion applied to its resident population and is compared to England, Lancashire and the North West, with significance to these areas provided. Tables 7 and 8 use England’s proportion and these are applied to the Blackpool population to produce a count.
Table 6: proportion and count for each question (England proportion and Blackpool count)
| Measure | Background (def/tend to agree) | Pull together (def/tend to agree) | Trusted (one or more person) |
|---|
|
Area
|
Proportion
|
Count/significance
|
Proportion
|
Count/significance
|
Proportion
|
Count/significance
|
|
Blackpool
|
73.2
|
86,795
|
38.6
|
45,769
|
26.1
|
30,948
|
|
Lancashire
|
79.4
|
Lower
|
58.6
|
Lower
|
46.4
|
Lower
|
|
North West
|
81.2
|
Lower
|
58.5
|
Lower
|
45.6
|
Lower
|
|
England
|
81.4
|
Lower
|
55.6
|
Lower
|
40.7
|
Lower
|
The proportion of people in Blackpool who definitely or tend to agree that people from different backgrounds get on well together is significantly lower than England, the North West and Lancashire and is one of the lowest authorities in the Lancashire area. The same applies for the belief that people in the neighbourhood pull together and that there are many people in the neighbourhood who can be trusted.
Table 7: age/sex breakdown by measure (England %, Blackpool count)
| Age | Background | Pull together | Trusted (many) |
|---|
| 16-24 |
77.8% (10,615)
|
44.3% (6,035)
|
24.8% (3,388)
|
|---|
| 25-34 |
78.5% (14,278)
|
48.0% (8,733)
|
28.1% (5,103)
|
|---|
| 35-49 |
80.6% (20,869)
|
56.6% (14,674)
|
37.2% (9,630)
|
|---|
| 50-64 |
81.8% (25,245)
|
57.5% (17,754)
|
45.0% (13,882)
|
|---|
| 65-74 |
85.4% (13,026)
|
63.0% (9,600)
|
54.9% (8,367)
|
|---|
| 75+ |
88.2% (12,993)
|
66.1% (9,735)
|
60.5% (8,918)
|
|---|
| Female |
82.4% (49,341)
|
56.3% (33,738)
|
41.7% (25,001)
|
|---|
| Male |
80.7% (47,359)
|
55.3% (32,439)
|
40.1% (23,506)
|
|---|
The younger age groups (16-24 and 25-34) are less likely to agree people from different backgrounds get on well together. The older age groups were more likely to agree or definitely agree that people in the local area would pull together to improve the neighbourhood, with the highest proportion in those aged 75 and over (66.1%). However, across all age groups (except 16-24) the proportion agreeing had decreased from the 2021/22 survey (for England).
Levels of trust appear to have stayed similar to the 2021/22 survey - there has been an increase in the number of respondents stating that 'a few' of the people can be trusted, compared to 'many', 'some', and 'none', which saw no change. The older age groups were more likely to state 'many' people in the neighbourhood can be trusted, with twice the rate in those 75 and over (60.5%) compared to those 16-24 (24.8%) and 25-34 (28.1%).
Table 8: deprivation decile breakdown by measure (England %, Blackpool count)*
| Decile | Background | Pull together | Trusted (many) |
|---|
| 1 (most deprived) |
69.2% (32,544)
|
41.9% (19,717)
|
18.1% (8,518)
|
|---|
| 2 |
73.9% (14,058)
|
44.7% (8,502)
|
22.7% (4,319)
|
|---|
| 3 |
76.5% (15,710)
|
45.8% (9,408)
|
27.2% (5,588)
|
|---|
| 4 |
79.7% (14,513)
|
51.2% (9,321)
|
34.2% (6,232)
|
|---|
| 5 |
81.7% (5,508)
|
54.2% (3,652)
|
39.1% (2,636)
|
|---|
| 6 |
83.8% (1,069)
|
58.2% (743)
|
44.4% (567)
|
|---|
| 7 |
85.9% (3,232)
|
62.7% (2,357)
|
49.8% (1,874)
|
|---|
| 8 |
87.1% (0)
|
64.3% (0)
|
52.8% (0)
|
|---|
| 9 |
88.1% (0)
|
66.2% (0)
|
56.8% (0)
|
|---|
| 10 (least deprived) |
90.1 (0)
|
69.6% (0)
|
63.3% (0)
|
|---|
Note: Blackpool does not have any LSOA in deciles 8 - 10, so no count is provided
The proportion increases as deprivation decreases across all three measures. The difference between deprivation deciles is starkest against the ‘people who can be trusted’ question, with only 18.1% of those in decile 1 agreeing that many people can be trusted, compared with 49.8% in decile 7. The only change across the trust question is an increase in the proportion who say a few people in the neighbourhood can be trusted.
Perception of change to the neighbourhood
How people view changes in their area is vital to understand what is happening in a community. Perception of change is also linked to trust and engagement with decision making in an area, and negative perceptions can also indicate issues such as increasing inequalities, concerns around community safety, or general dissatisfaction for example. Fewer people in England felt that their local area has got better to live in over the past two years, compared to the 2021/22 survey, while those who believe it has got worse has increased. In Blackpool, 8.5% (10,079) of people believe the area has got better, which is similar to England (11.4%) and Lancashire (11.6%), but significantly lower than the North West (12.7%).
Figure 3: proportion of people who believe the area has improved over the last two years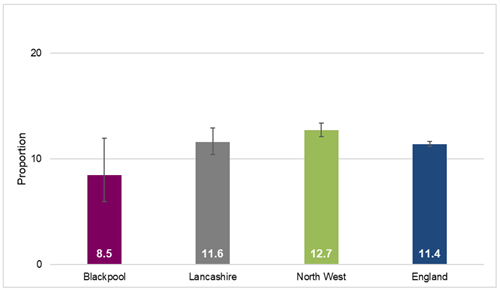
The younger age groups are more likely to believe the area has got better to live in, with 16.6% of 25-34-year-olds (3,021) and 15.3% of 16-24-years (2,092) agreeing, compared to 6.7% of the over-74s (989) and 7.7% of those 65-74 (1,167). Across all age groups (except 16-24) the proportions agreeing have decreased from the 2021/22 survey.
Those in the more deprived areas are more likely to believe the area has got better, compared to the less deprived areas, although the differences are relatively small. This may be in part due to regeneration projects or input to improve more deprived areas through other means.
Civic engagement
For responsive, inclusive and thriving communities, people should be confident they have a voice. Allowing people to be heard or feel that they can contribute and affect decision making means they are more likely to become involved in their community, take pride and ownership and become responsive citizens, rather than passive observers. Feeling heard can also strengthen bonds between neighbours, building a shared sense of purpose.
Better decision making is key, and how we listen to our communities and use their input to support and improve services for our residents is crucial. This can also improve trust in our local decision makers and in turn improve the perception and views of our council and services.
For civic consultation, the CLS asked whether people had engaged in any of the following (England values): completed a paper or online questionnaire (13.9%, no change from 2021/22); attended a public meeting (3.9%, increase); been involved in a face to face or online group (2.9%, decrease); or none of the above (81.6%, no change). Overall, the proportion for Blackpool (14.2% any civic engagement) is significantly lower than England and similar to Lancashire and the North West.
Figure 4: proportion of people who have engaged in any civic consultation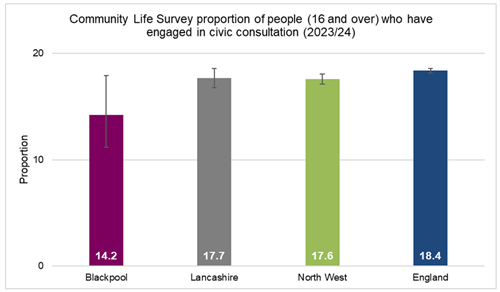
Civic activism
For civic activism, only 4.7% have been involved in Blackpool, which is significantly lower than England (7.7%), the North West (8.0%) and Lancashire (8.3%). More people were likely to be a school governor (1.2%), a special constable or a volunteer at a higher rank (1.0%), while 97% of people had no involvement (England values). The table below shows the involvement of people in various groups.
Table 9: respondents involved in the following groups (England proportions) and change from 2021/22 survey
| Have you been a member of a... | Change | % |
|---|
| Group making decisions on local health services |
No change |
1.1 |
| Decision-making group set up to regenerated the local area |
No change |
1.3 |
| Decision-making group tackling local crime problems |
No change |
0.8 |
| Tenants' group decision-making committee |
No change |
1.3 |
| Group making decisions on local education services |
No change |
0.7 |
| Group making decisions on local services for young people |
Increase |
0.9 |
| Group making decisions on services in the local area |
Increase |
2.5 |
| None of these |
Decrease |
93.6 |
Please note, these values will not sum to 100% as respondents may answer ‘yes’ to more than one question
Further information
The full survey findings can be found at the Community Life Survey - GOV.UK website. For the Blackpool picture, please see our survey findings. The results of the survey can provide insight into people's attitudes and support other intelligence or data available for a local area.
*The deprivation tables are based on the Index of Multiple Deprivation (2019) and mid-year 2022 lower layer super output area (LSOA) population estimates, and will be an underestimate of the 16 years and over population.
Each LSOA is assigned to a deprivation decile (1 to 10), where 1 is the most deprived and 10 the least. Each LSOA has an estimated population. The 16 and over population for each LSOA is calculated. These are then totaled by LSOA to give the population for each decile. The England percentage is applied to this decile population to get a count for Blackpool. As Blackpool has more LSOAs in the more deprived deciles, so the counts will be higher, despite the lower proportions who agree. Blackpool does not have any areas in deciles 8-10 so no count provided.
References
[i] Loneliness as a Health Issue, The Lancet, 2023 Loneliness as a health issue - The Lancet