Cardiovascular Disease
Last Modified 03/12/2025 13:52:19
Share this page
Introduction
Cardiovascular disease (CVD) affects more than 1 in 4 adults in England and is the second largest single risk factor for premature death and disability in the country. There have been huge gains over the past decades in terms of better treatment for CVD and improvements in lifestyle, but to ensure that there continues to be a reduction in the rate of premature mortality from CVD, there needs to be concerted action on both prevention and treatment.
Cardiovascular disease is defined as all the diseases of the heart and circulatory system, including coronary heart disease (angina and heart attack), and stroke. Around one-third of all deaths in the UK are due to these diseases.
Heart attacks and strokes are usually acute conditions and are mainly caused by a blockage that prevents blood from flowing to the heart or brain. The most common reason is a build-up of fatty deposits on the inner walls of the blood vessels. Strokes can be caused by bleeding from a blood vessel in the brain or by blood clots.
CVD becomes increasingly common in people over the age of 60 and is rare below the age of 30.
Facts and figures
Prevalence of cardiovascular diseases
For further information regarding the source of NHS Quality and Outcomes Framework (QOF) prevalence data and its limitations please see the note on QOF Data.
Coronary heart disease is the most common type of heart disease and cause of heart attacks. The disease is caused by plaque building up along the inner walls of the arteries of the heart, which narrows the arteries and reduces blood flow to the heart.
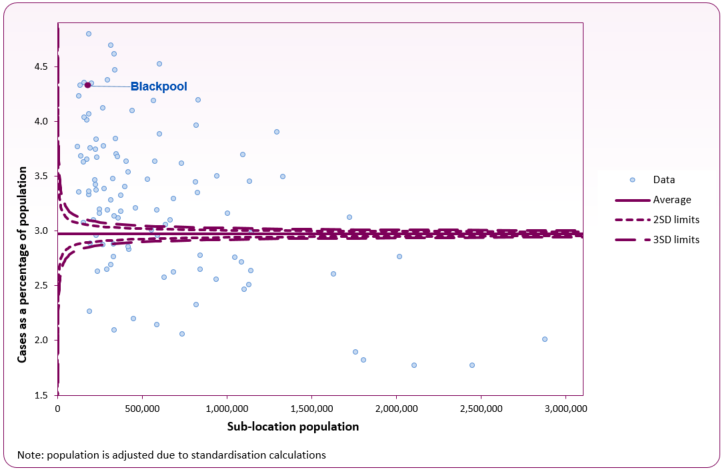
In 2023/24, 7,727 people (all ages) in the Blackpool ICB sub-location (formerly NHS Blackpool CCG) were identified as living with coronary heart disease (CHD).1 This equates to 4.3%, which is significantly higher than the England average (3.0%) and the trend shows no change. It is estimated that this accounts for only 70% of the total population in Blackpool living with CHD and there are likely to be approximately 3,350 people with undiagnosed CHD.2
Blackpool's sub-location is shown as a purple marker in figure 1, with all other sub-locations across England shown in blue. Blackpool is in the 10% of sub-locations with the highest rate in England.
Figure 1: CHD prevalence funnel plot analysis at sub-ICB level (2023/24 QOF)
 Source: Cardiovascular Disease - OHID (Office for Health Improvement and Disparities)
Stroke is the loss of brain function due to a disturbance in the blood supply to the brain. Risk factors for stroke include old age, high blood pressure, previous stroke or transient ischemic attack (TIA), diabetes, high cholesterol, tobacco smoking and atrial fibrillation. High blood pressure is the most important modifiable risk factor of stroke. There is evidence that appropriate diagnosis and management can improve outcomes.
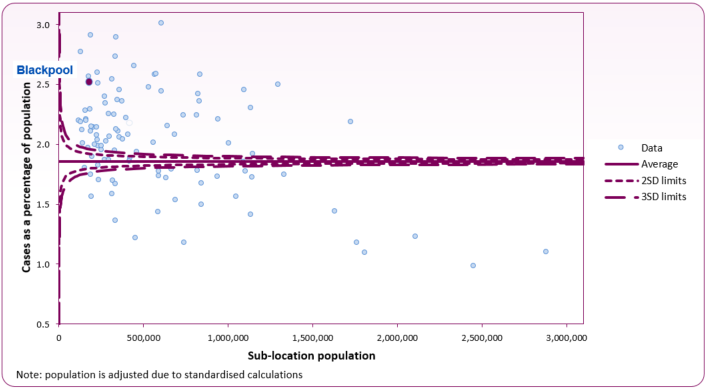
In 2023/24, 4,495 people (all ages) in the Blackpool ICB sub-location (formerly NHS Blackpool CCG) were identified as having previously experienced a stroke or ischaemic attack.1 This equates to 2.5%, which is significantly higher than the England average (1.9%).
Blackpool's sub-location is shown as a purple marker in figure 2, with all other sub-location shown in blue. Figure 2 shows that Blackpool has one of the highest rates of stroke in England, ranking 13th. For further summary data about stroke prevalence in Blackpool please see the Office for Health Improvement and Disparities' OHID Stroke Profile.
Figure 2: stroke or transient ischaemic attack prevalence funnel plot analysis at sub-location level (2023/24 QOF)
 Source: Cardiovascular Disease - OHID
Hypertension is a chronic medical condition in which the blood pressure in the arteries is elevated. It affects approximately 22% of the population. Hypertension puts a strain on the heart, leading to hypertensive heart disease and coronary artery disease if not treated. Hypertension is also a major risk factor for stroke, aneurysms of the arteries (e.g. aortic aneurysm), and peripheral arterial disease and is a cause of chronic kidney disease. A moderately high arterial blood pressure is associated with a shortened life expectancy while mild elevation is not. Dietary and lifestyle changes can improve blood pressure control and decrease the risk of health complications, although drug treatment is still often necessary in people for whom lifestyle changes are not enough or not effective.
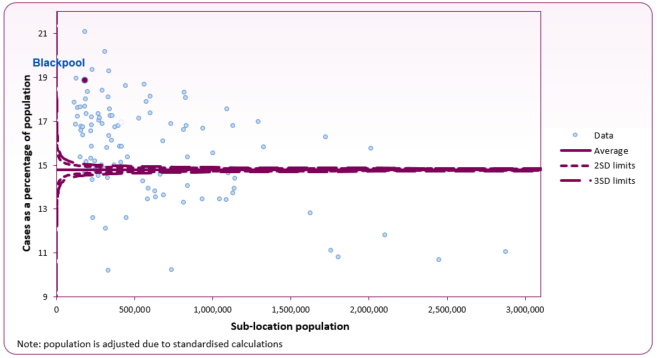
In 2023/24, 33,736 people (all ages) in the Blackpool ICB sub-location (formerly NHS Blackpool CCG) were identified as having hypertension.1 This equates to 18.9%, which is significantly higher than the England average (14.8%), with an increasing trend. Blackpool's sub-location is shown as a purple marker in figure 3, with all other sub-location shown in blue. Figure 3 shows Blackpool has one of the highest rates of hypertension across England.
The Office for Health Improvement and Disparities (OHID) estimated that in 2021, 9% of adults (registered with a Blackpool GP practice) had undiagnosed hypertension (England 8.6%).2
Figure 3: hypertension prevalence funnel plot analysis at sub-location level (2023/24 QOF)
 Source: Cardiovascular Disease - OHID
Hospital admissions
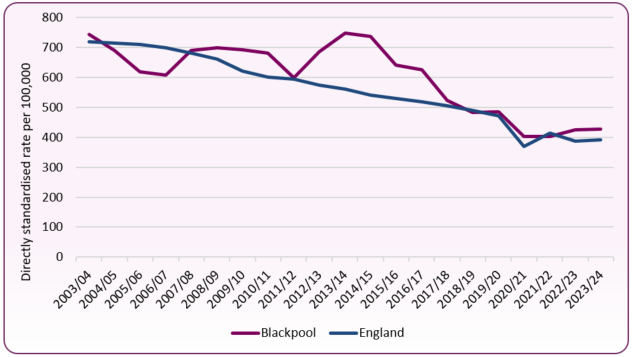
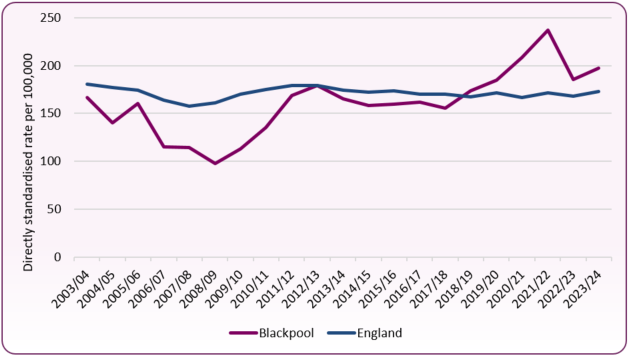
In 2023/24, the Blackpool rate of admissions for a primary diagnosis of coronary heart disease was 428.1 per 100,000 population (all ages), significantly higher compared to 390.6 per 100,000 across England. The rate of hospital admissions for CHD has decreased nationally since 2003/4. In Blackpool the rate has declined since 2013/14, when it was 748.5 per 100,000 (figure 4). The chart also shows hospital admissions for CHD reducing sharply during the COVID-19 pandemic in 2020.
Figure 4: hospital admissions for coronary heart disease (all ages), Blackpool and England, 2003/4 to 2023/24
 Source: Cardiovascular Disease - OHID
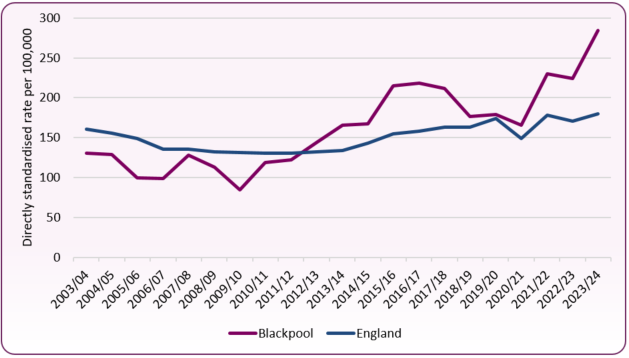
The 2023/24 admission rate for a primary diagnosis of stroke across Blackpool was 197.1 per 100,000 population (all ages), significantly higher compared to 173.1 per 100,000 across England. The national rate of hospital admissions for stroke slowly declined between 2012/13 and 2018/19. Blackpool's rate followed this trend until 2018/19 when the rate rose above the national average for the first time (figure 5). During the COVID-19 pandemic (2020/21 and 2021/22), the chart shows the rate continued to increase, falling in 2022/23, before increasing again in 2023/24.
Figure 5: hospital admissions for stroke (all ages), Blackpool and England, 2003/4 to 2023/24
 Source: Cardiovascular Disease - OHID
The 2023/24 hospital admission rate across Blackpool for heart failure was 284.3 per 100,000 population (all ages), significantly higher than the England rate of 179.6 per 100,000. Blackpool's admission rate increased more steeply than the national level between 2009/10 and 2016/17. After falling slightly to 2020/21 (figure 6) the rate has risen sharply again, with Blackpool having one of the highest rates in the country.
Figure 6: hopsital admissions for heart failure (all ages), Blackpool and England, 2003/4 to 2023/24
 Source: Cardiovascular Disease - OHID
Mortality from cardiovascular diseases
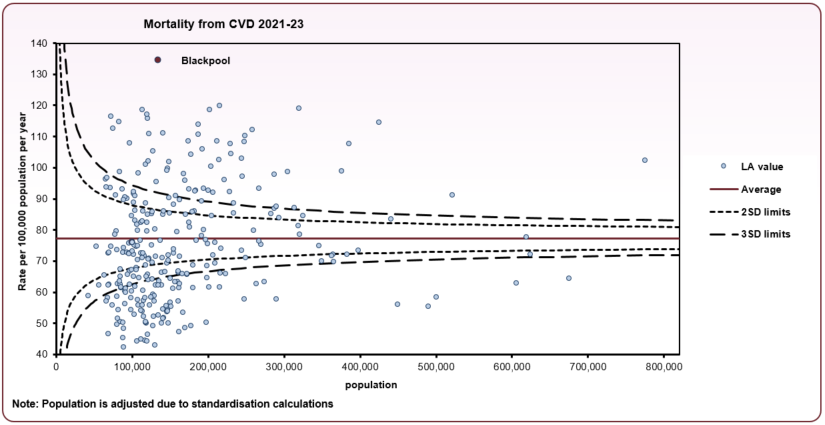
There were 544 deaths from CVD in people aged under-75 across Blackpool between 2021 and 2023. The directly standardised mortality rate (in this case per 100,000 population) is calculated to allow comparison between geographies of different population sizes and with different gender and age make ups. As displayed in Figure 7, Blackpool's mortality rate from CVD in those aged under-75 (134.5 per 100,000) is the highest in the country and over 70% higher than England (77.9 per 100,000).
Figure 7: funnel plot of mortality from all cardiovascular diseases, under-75 years - lower tier local authorities
 Source: OHID Mortality Profile
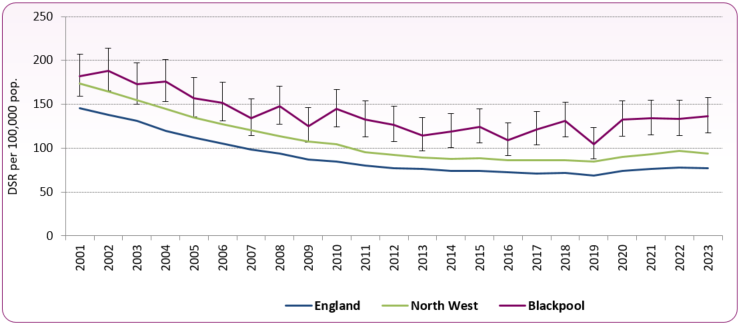
Figure 8 shows the annual trend in mortality from cardiovascular diseases in those aged under-75, comparing Blackpool to the North West and England averages. Over the long term to 2019 there was a decrease in mortality from cardiovascular diseases both nationally and in Blackpool, although the mortality rate in Blackpool is significantly higher than both the national and regional rates. The impact of the COVID-19 period 2020 can be seen in data, with slight increases in CVD mortality rates regionally and nationally to 2023. In Blackpool there were 185 deaths from CVD in 2023 and 178 in 2022. Local annual numbers and rates are often subject to variation due to relatively low numbers, and trends may only become apparent over longer time periods.
Figure 8: annual trend in CVD mortality, people under-75 - 2001 to 2023
 Source: OHID Mortality Profile
Figure 9 shows the difference in male and female mortality for those aged under 75 years. Of the 544 deaths in 2021-23 in Blackpool, 71% were male and 29% female, which is similar to the England average split (69% and 31%). In Blackpool, rates for both sexes are significantly higher than the national average.
Figure 9: mortality from CVD, males and females aged under-75, 2021-23 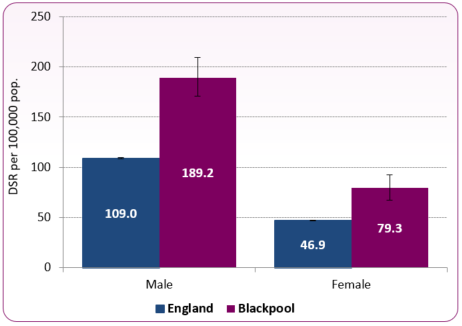 Source: OHID Mortality Profile
Figure 10 shows mortality from ischaemic heart disease in people aged under 75 years for lower tier local authorities in England. There were 316 deaths in 2021-23, a Blackpool rate of 77.5 per 100,000 population, significantly higher than the England average of 41.2 per 100,000.
Figure 10: funnel plot of mortality from ischaemic heart diseases, under-75 years, 2021-23 - lower tier local authorities
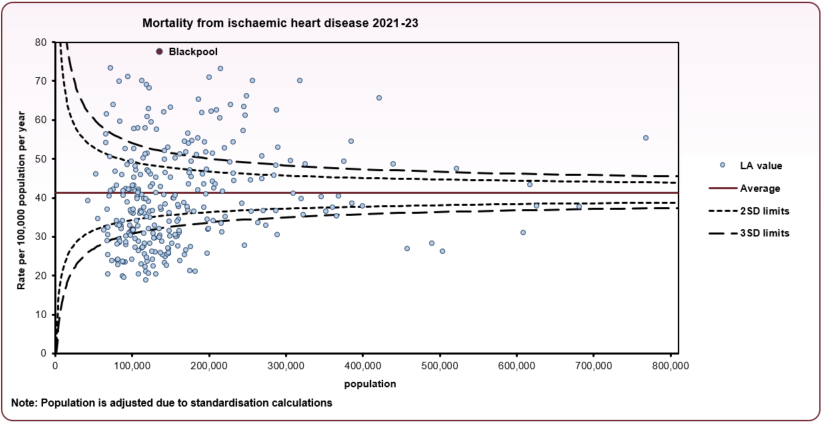 Source: OHID Mortality Profile
Figure 11 shows mortality from stroke in people aged under-75 years for lower tier local authorities between 2021 and 2023. Across Blackpool there were around 87 deaths from stroke in people aged under-75 (2021-23). The mortality rate from stroke in Blackpool for those under-75 is sigificantly higher than the national average and is the second highest in England.
Figure 11: funnel plot of mortality from stroke, under-75 years, 2021-23 - lower tier local authorities
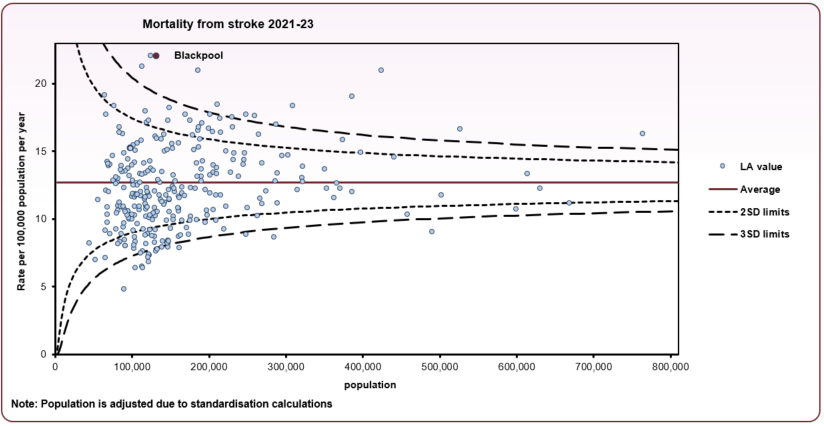 Source: OHID Mortality Profile
Preventable mortality
The basic concept of preventable mortality is that deaths are considered preventable if, in the light of the understanding of the determinants of health at the time of death, all or most deaths from the underlying cause (subject to age limits if appropriate) could potentially be avoided by public health interventions in the broadest sense.
-
- In 2021-2023 in Blackpool, 40.8% (222) of deaths from cardiovascular diseases in people aged under 75 were considered preventable (compared to 39.5% nationally).
- Blackpool's preventable under-75 mortality rate for cardiovascular diseases of 54.7 per 100,000 population (directly standardised rate) was significantly higher than the national average of 30.5 per 100,000 (2021-2023).
- For males, Blackpool has the highest rate of under-75 preventable mortality (78.5 per 100,000); for females this is third highest (30.5 per 100,000).
- Blackpool's preventable mortality rate for cardiovascular diseases of 52.3 per 100,000 population (DSR) was significantly higher than the national average of 29.2 per 100,000.
Services
-
- The Sentinel Stroke National Audit Programme (SSNAP) publishes national and local level findings on the organisation of stroke services, including acute care organisation, staffing and pathway at discharge. It reflects the organisation of stroke services as at July 2019 and gives a comprehensive picture of current services. Results for Blackpool Teaching Hospital show it meets 6 out of the 10 key indicators on stroke service organisation.
SSNAP Acute Organisational Audit 2019 for Blackpool Teaching Hospital NHS Foundation Trust  (270 KB)
National and local strategies
Risk factors
Risk factors for CVD include:
-
- high blood pressure (hypertension)
- smoking
- high blood cholesterol
- diabetes
- lack of exercise
- being overweight or obese
- family history of heart disease
- ethnic background
Many of the above risk factors are linked. This means that if you have one risk factor, you're more likely to have others.2
[] OHID, National General Practice Profiles
[] OHID, Hypertension Prevalence and Management, October 2020