Cancer
Last Modified 17/07/2026 13:50:52
Share this page
Introduction
Cancer occurs when abnormal cells within the body divide in an uncontrolled way. Some cancers may eventually spread into other tissues. Most cancers start due to gene changes that happen over a person's lifetime, with certain lifestyle and environmental factors increasing the risk of developing cancer. More rarely cancers start due to inherited faulty genes passed down in families.
Cancer is a common condition and one in two people living in the UK will develop the disease at some point in their lifetime. Over 250,000 people in England are diagnosed with cancer every year and around 130,000 die from the disease. Currently, in England, about 2.4 million people are living with a cancer diagnosis, with 8,291 of these people registered to a Blackpool GP practice (Quality and Outcomes Framework, 2024-25). Surveys show that people's fear of cancer is more prevalent than any other concern.1
Facts and figures
Incidence of cancer
Incidence is defined as the number of new cases identified in a given period of time.
In Blackpool in the five-year period between 2019/20 and 2023/24 there are on average 1,144 new cases of cancer identified each year. Figure 1 shows the trend in the cancer incidence rate in Blackpool and England. The incidence rate (in this case directly standardised per 100,000 population) is calculated to allow comparison between geographies of different population sizes and with different sex and age make ups.
Across England, cancer incidence rose slightly through the 2000s, but this trend stopped around 2013. Cancer incidence in Blackpool has remained consistently higher than that seen nationally, with rises in both male and female incidence between 2017 and 2019, although this has dropped off. It is likely that the COVID-19 pandemic meant people were less likely to contact a health professional with cancer symptoms, and this may have contributed to the reduced incidence.
Figure 1 - incidence of all malignant cancers (all ages) excluding non-melanoma skin cancer (NMSC)* - 2001-2022 annual trend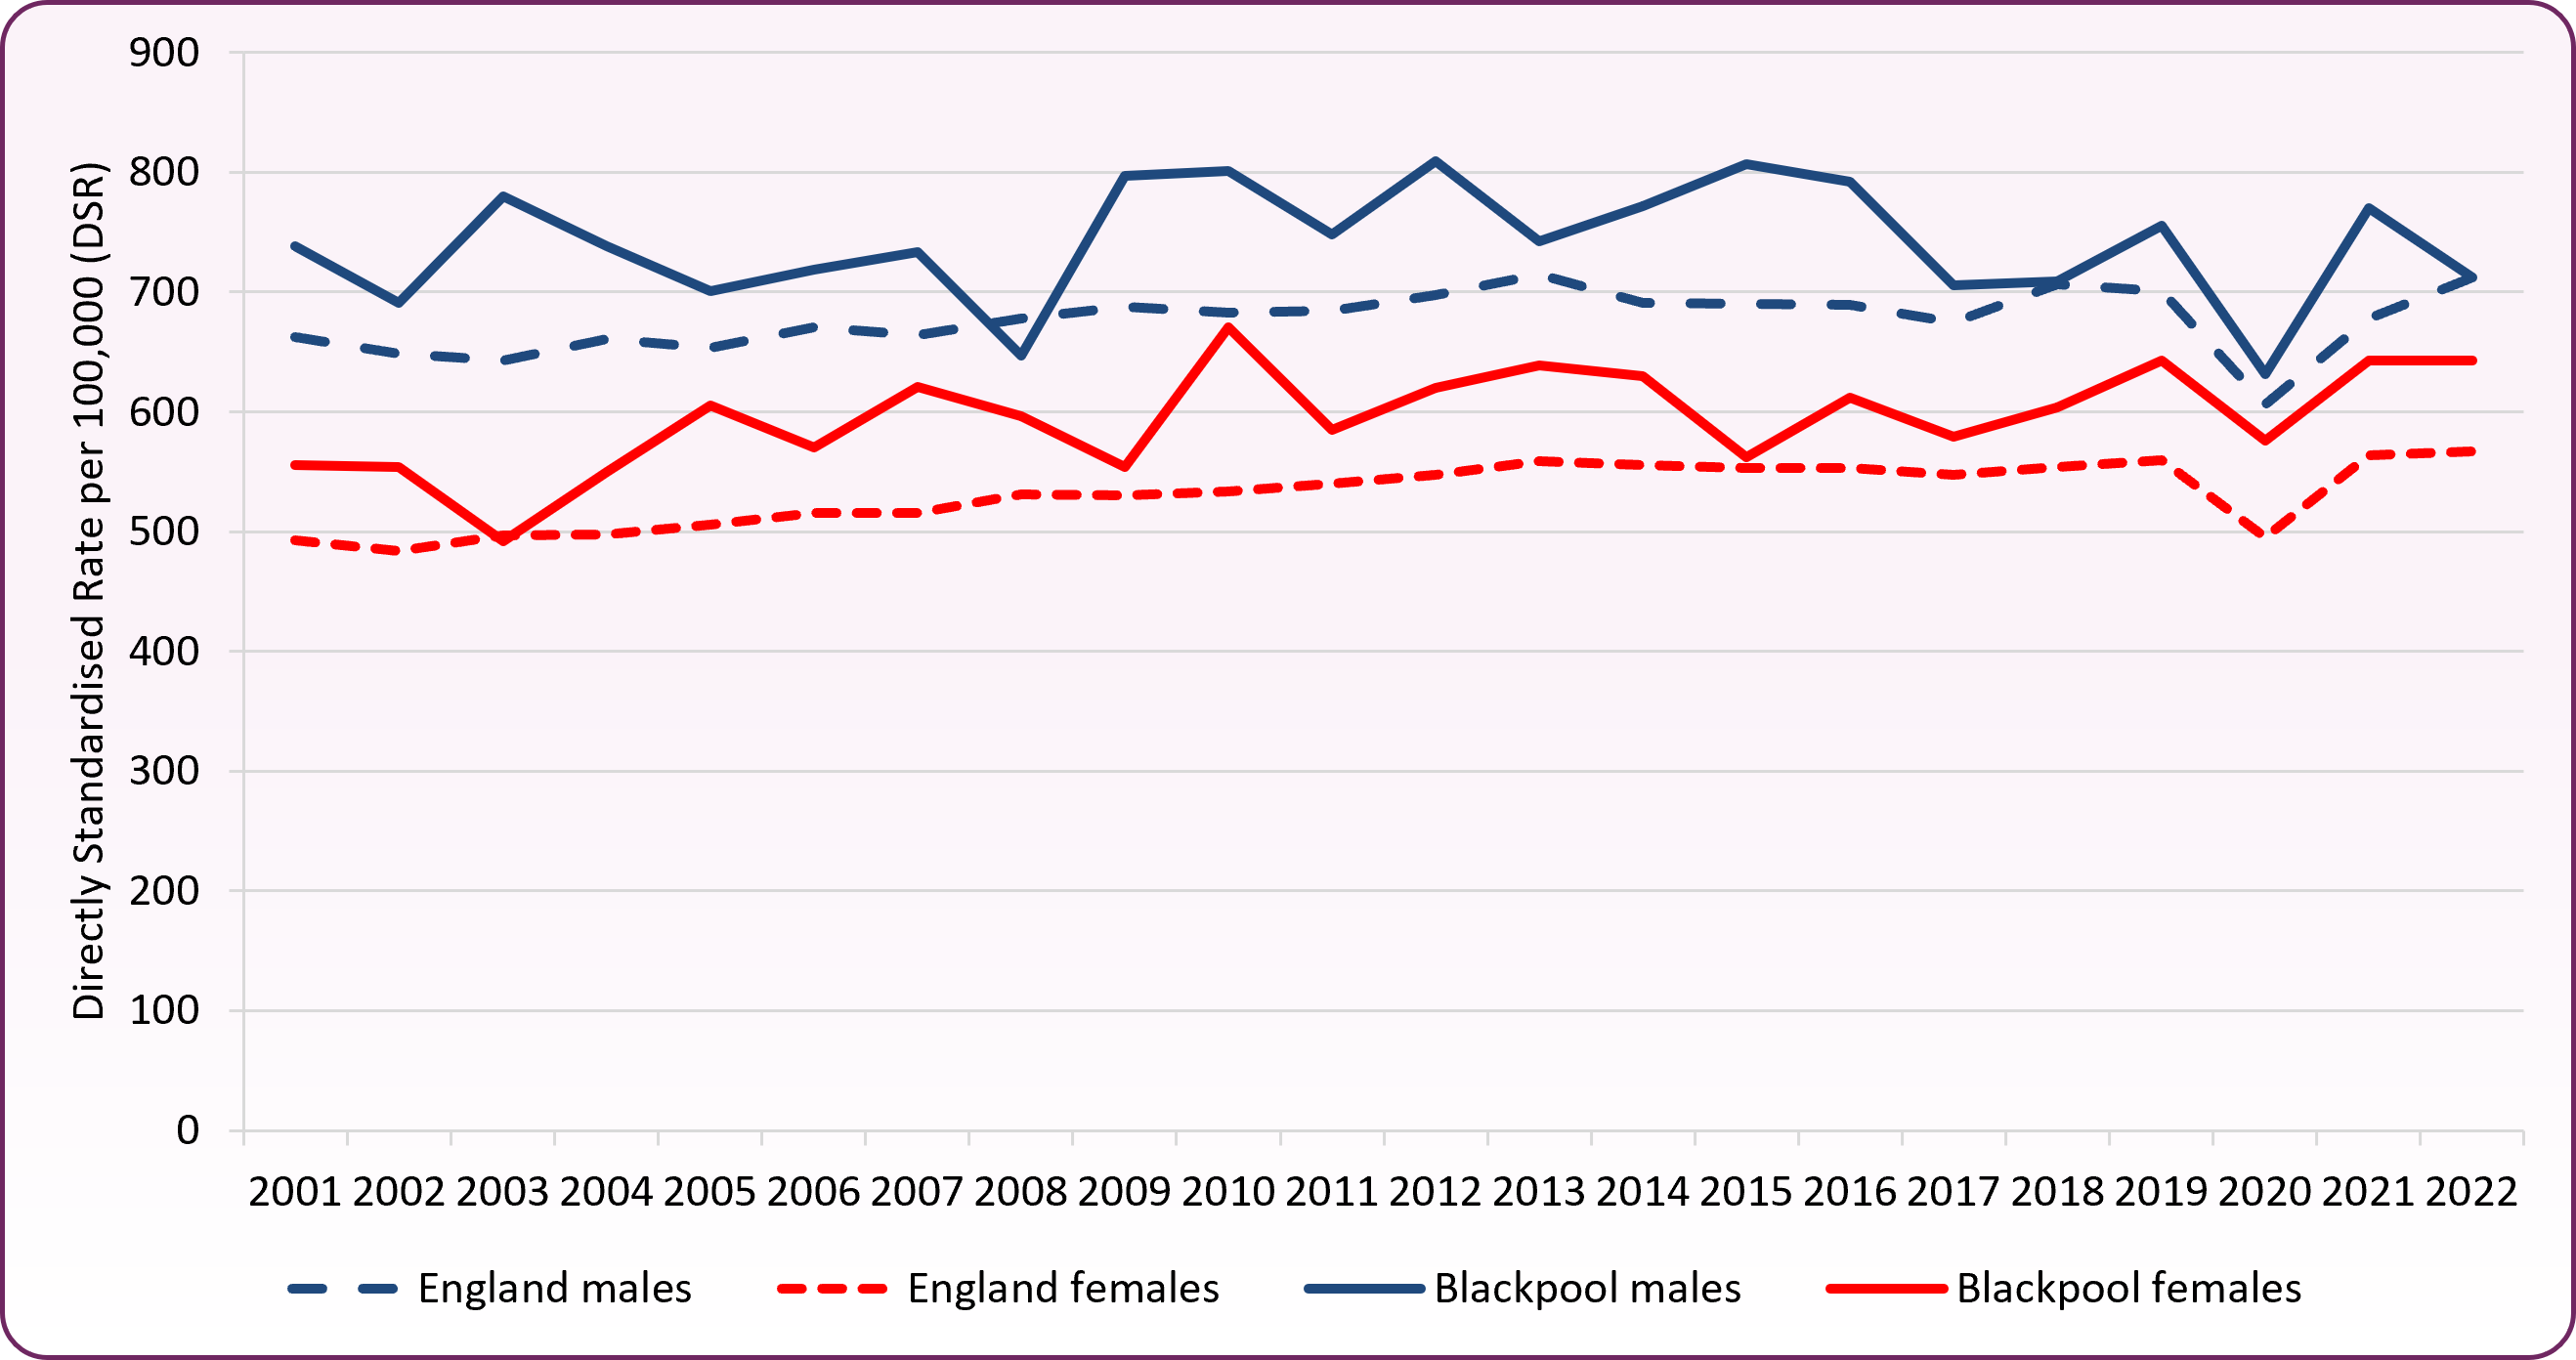
Source: National Cancer Registration and Analysis Service (NCRAS) - local authority level data *cases of non-melanoma skin cancer (NMSC) have been inconsistently recorded over time and geography. Consistent comparisons over time and geography are made by excluding NMSC from trend data.
Prevalence of cancer
Prevalence refers to the number of people who have previously received a diagnosis of cancer and who are still alive at a given time. This reflects both the incidence of cancer and its associated survival pattern. High prevalence indicates high incidence and/or long survival, whereas low prevalence indicates low incidence and/or short survival.
Overall the Blackpool sub-location (formerly NHS Blackpool Clinical Commissioning Group) has a higher recorded prevalence of cancer compared with the national picture. During 2024/25, there were 8,291 people registered with Blackpool GP practices with a diagnosis of cancer. This is a prevalence rate of 4.6%, significantly higher than the national prevalence rate of 3.8%.2
Mortality from cancer
Whilst the overall incidence rate of cancer has increased nationally, the rate of people dying from cancer has decreased.
Each year in Blackpool there are approximately 400 - 500 deaths from cancer, which usually accounts for around a quarter of all deaths in the area. In 2024, there were 462 deaths (all ages, all people). The directly standardised mortality rate (in this case per 100,000 population) is calculated to allow comparison between geographies of different population sizes and with different gender and age make ups. Overall, mortality rates for cancers are significantly higher in Blackpool (306.5 per 100,000) compared to the England rate (246.4) for 2022-24. The most common causes of death from cancer in Blackpool are lung, bowel and breast cancer.
Based on Office for National Statistics annual mortality extracts (for 2022-24) lung cancer accounts for a greater proportion of cancer deaths in Blackpool compared to England amongst people of all ages (24.0% compared to 18.8%) and for under-75s (26.8% compared to 20.3%).
Just under half of cancer deaths occur in people aged under-75 in Blackpool (48.8%) compared to 42.5% in England (202-24). Figure 2 shows the three-year (2022-24) mortality funnel chart, indicating that Blackpool has the highest under-75 mortality rate in England (significantly worse than England).
Figure 2 - mortality from all cancers, persons aged under-75 - 2022-24 lower tier local authorities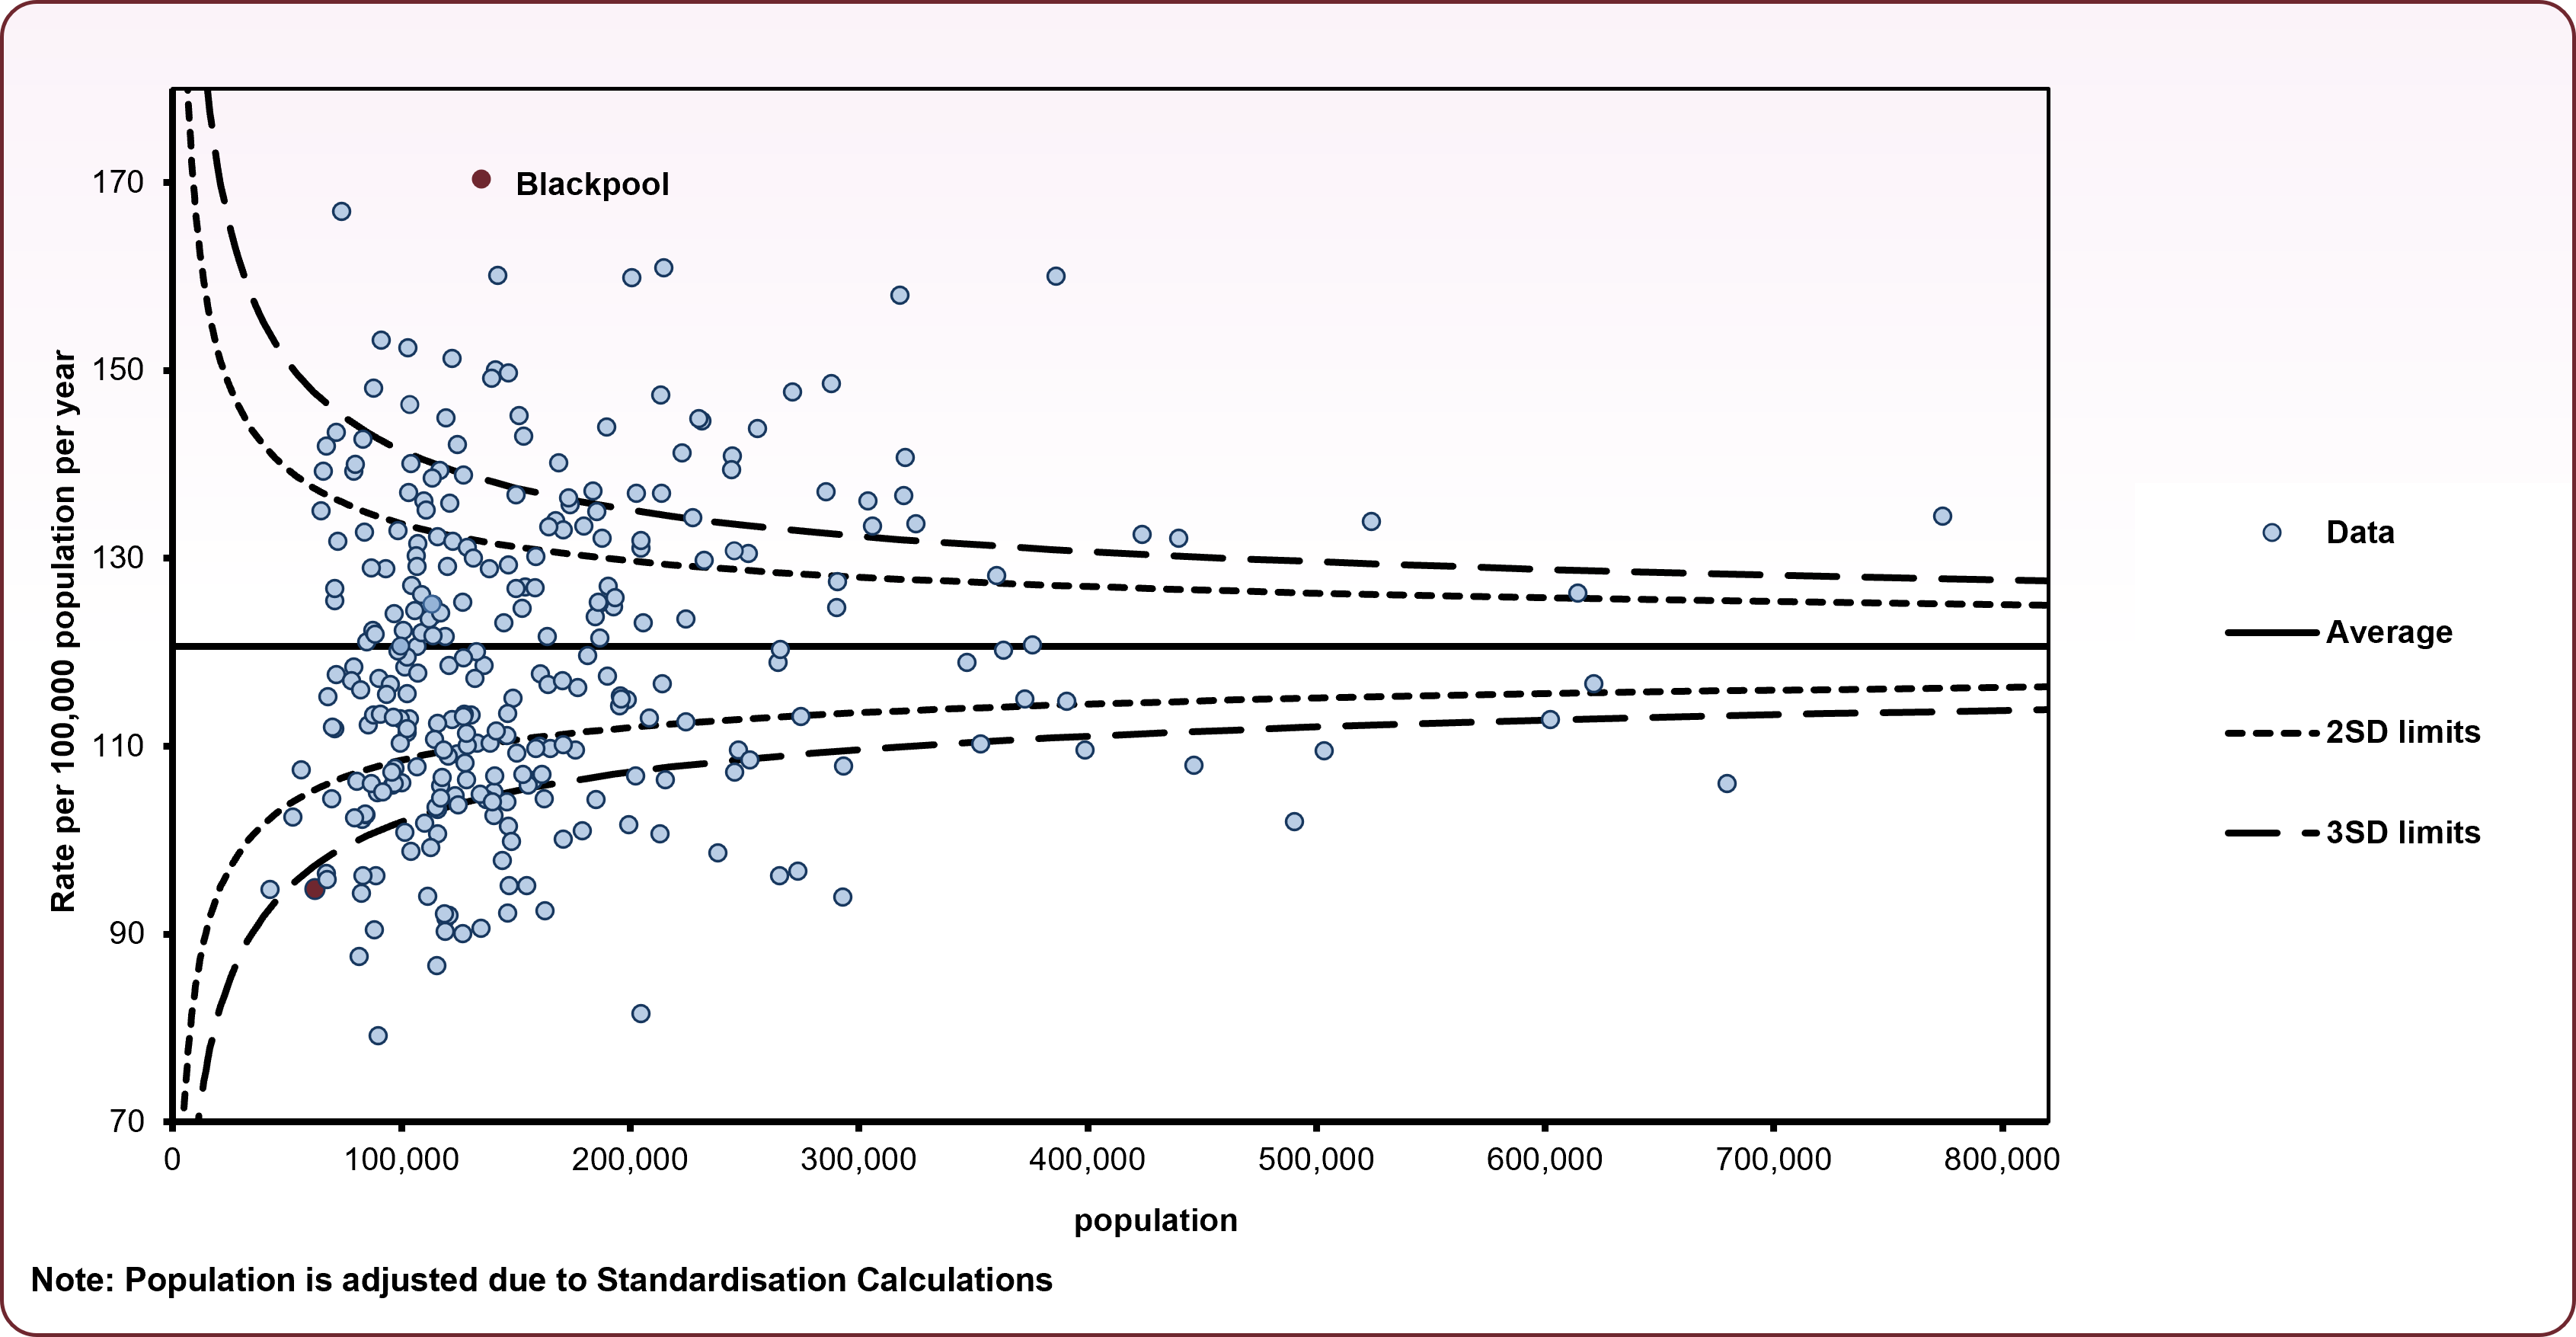
Source: OHID, Mortality Profile
Over the last 25 years, cancer mortality rates amongst under-75s have shown an overall improvement, however the mortality rate in Blackpool has remained consistently higher than seen nationally and in the North West for males, whilst for females, the rates are similar. The decline in the under-75 male mortality rate from 2016 to 2020 has now reversed, with large increases from 2021 onwards. The increase in the female rate shows the peak over the last ten years occurring in 2021, although rates have since shown a decrease overall to 2024 (figure 3).
Figure 3 - trend in cancer mortality (aged under-75), 2001-2024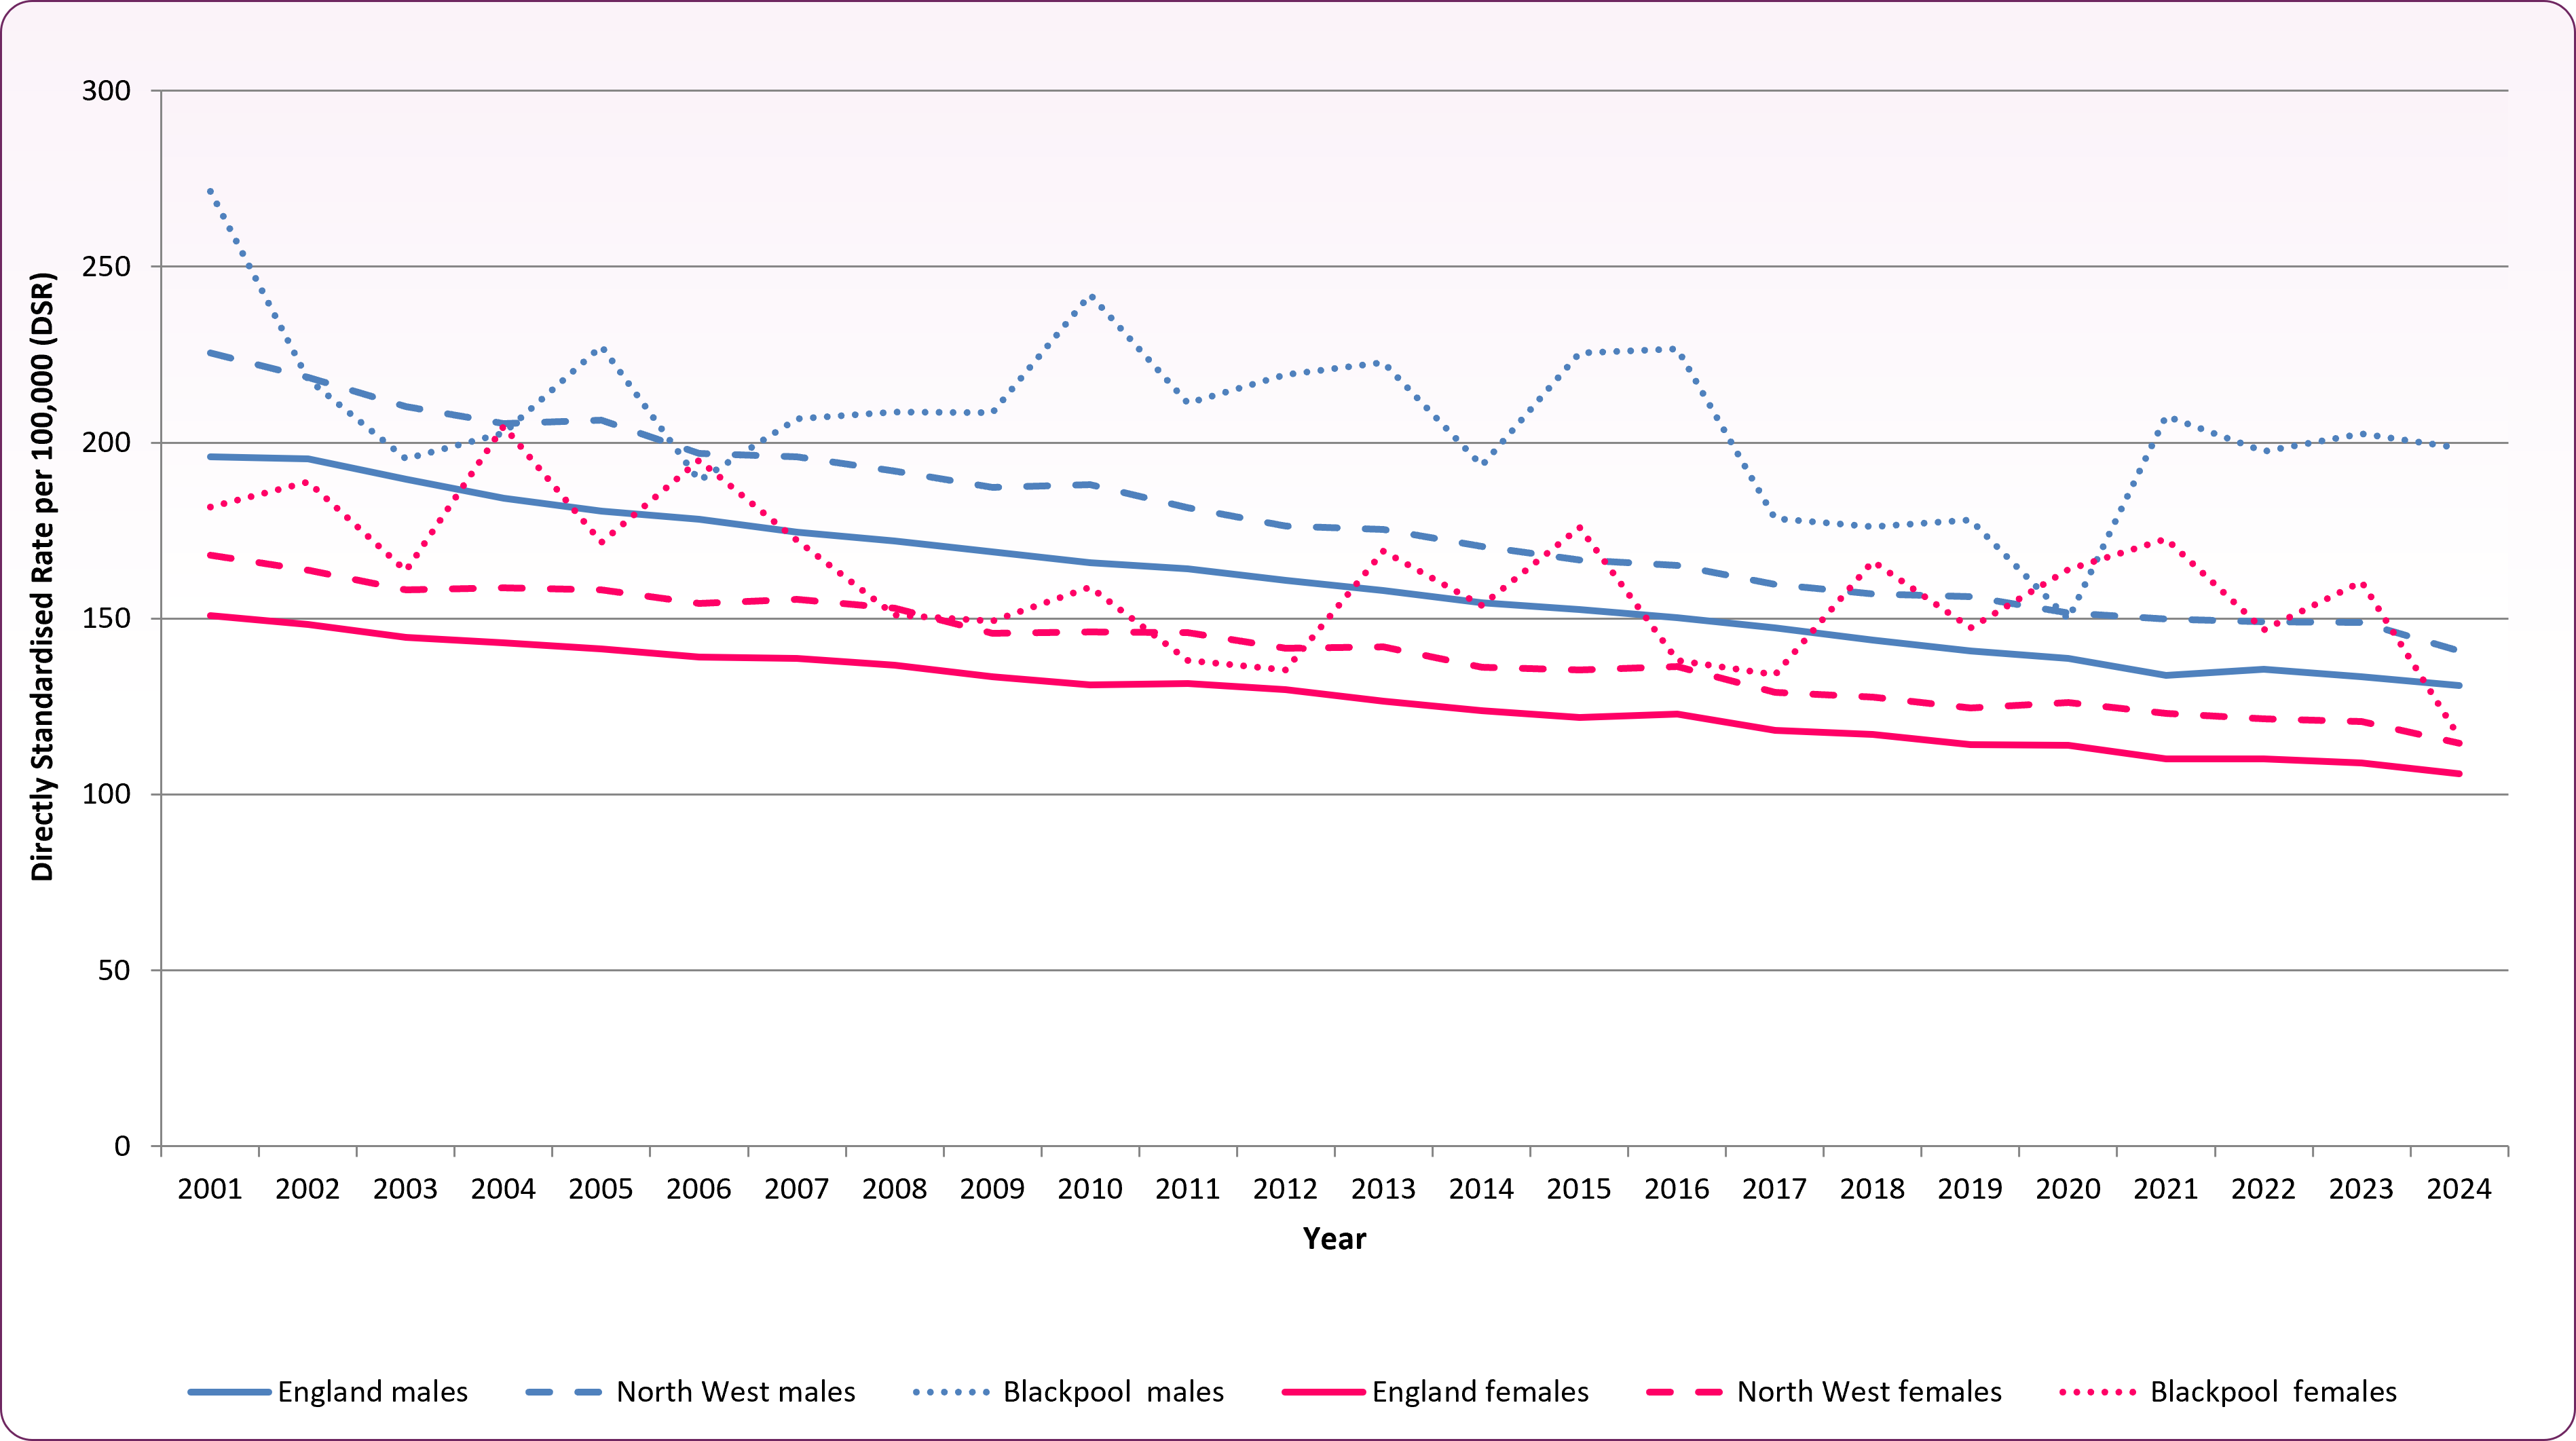
Source: OHID Mortality Profiles
Cancer survival
Cancer survival rates give an indication of successful service provision, and variations could indicate practice that may need to be investigated further.
One-year cancer survival is defined as the proportion of individuals that survive for a year after diagnosis. The most recent data for 2020 show the one-year cancer survival was 71.3% for individuals registered in Blackpool's sub-location (formerly NHS Blackpool Clinical Commissioning Group), compared to the England average of 74.6%. This survival rate is the fifth lowest in the country. One-year cancer survival for Blackpool patients has, however, improved significantly, rising from 61.1% in 2005 in line with increases seen nationally (note: these are the most up to date figures available as of July 2026).
Summary of cancer incidence, mortality and survival in Blackpool
Table 1 shows the most common types of cancer and summarises incidence, mortality and survival rates using directly standardised rates per 100,000 resident population.2
Table 1: summary of cancer incidence, mortality and survival in Blackpool
| | Incidence - all ages | Mortality - age under-75 | Mortality - all ages | One-year survival |
|---|
| | (2020-22) | (2022-24) | (2022-24) | (2020) |
|---|
| Breast (females only) |
162.6
|
18.9 |
31.4 |
96.3% |
|---|
| Lung |
119.6* |
45.9* |
73.6* |
46.2% |
|---|
| Prostate (males only) |
126.9+ |
-- |
41.2 |
-- |
|---|
| Colorectal |
79.4 |
17.8* |
33.6* |
71.4% |
|---|
| Cervical (females only) |
9.6 |
-- |
-- |
-- |
|---|
*denotes value is significantly higher than England average; +denotes significantly lower than national average, -- Local data is not available.Source: OHID Mortality Profiles
Cancer and inequality
The Cancer in the UK 2025 socioeconomic deprivation report from Cancer Research UK looks specifically at demographic inequalities. Some key findings:
-
- Incidence is higher in people living in more deprived areas largely due to the higher prevalence of risk factors like smoking and obesity.
- People living in more deprived areas may have lower awareness of cancer symptoms and experience more barriers to seeking help for those symptoms.
- This contributes to higher proportions of cancer cases among people living in more deprived areas being diagnosed via an emergency presentation and at a later stage.
- Those in more deprived areas are more likely to experience long waits from urgent referral for suspected cancer to starting treatment. For some cancer types, they are less likely to receive certain treatments.
- Cancer survival is lower in people living in more deprived areas. This is linked to later-stage diagnosis, due partly to lower uptake of screening for early diagnosis, and treatment differences.
- People living in more deprived areas have significantly higher cancer mortality rates compared with those in less deprived areas. This reflects their higher cancer incidence rates and lower cancer survival.
Inequalities in cancer screening, diagnosis and treatment
The Lancet's 'Health Inequalities in Cancer Care: a Literature Review of Pathways to Diagnosis in the United Kingdom' journal article (2024) identifies a number of factors contributing to inequities in access to services, diagnosis and outcomes. These include health literacy, ethnicity, socioeconomic status, age, gender, disability, geography and lifestyle.3
- Disparities in health literacy can lead to delayed presentation to healthcare services, resulting in later diagnosis and reduced treatment options. Lower health literacy is more likely among those from ethnic minorities and those in more deprived areas.
- Ethnic minority groups also experience variation in incidence and outcomes due to genetics, cultural differences and socioeconomic status within their communities.
- Age-related barriers can include physical frailty, cognitive decline and mobility challenges - all of which can impede access to healthcare services for older people.
- There are differences in healthcare for the LGBTQ+ community generally; this may be linked to knowledge gaps, attitudes of healthcare professionals and stigma, concerns around confidentiality, or reluctance to seek help due to prior negative experiences.
- Lifestyle factors such as smoking, poor diet, excess alcohol consumption and low levels of physical activity are known to contribute to variations in cancer rates. Poverty and debt often exacerbate unhealthy behaviours, with those living in the most deprived areas more likely to have poor health behaviours.
Inequalities in cancer survival and mortality
The Cancer in the UK 2025 socioeconomic deprivation report from Cancer Research UK identified how deprivation impacts both the diagnosis and treatment of their cancer, with comorbidities affecting treatment options as well as the likelihood of surviving the disease. People living in more deprived areas have worse cancer survival compared to those in the least deprived areas, for many cancer sites, across the UK. In England, for bowel cancer, only 52.6% of people from the most deprived areas survive the disease for five years compared to 61.5% in the least deprived. For breast cancer (female only) this is 82% (most deprived) and 88% (least deprived); for lung cancer this is 18% (most deprived) and 25% (least deprived); for prostate cancer (male only) this is 86% (most deprived) and 89% least deprived.
The report also found that cancer mortality rates are almost 60% higher in people in the most deprived areas compared to the least (337 per 100,000 vs 217 per 100,000). This equates to around 28,400 excess cancer deaths linked to deprivation. Almost half of the deprivation-associated deaths are due to lung cancer, with the most deprived areas of England having a rate almost three times that of the least (90 per 100,000 vs 32 per 100,000).
Within those who are disadvantaged, work should target overcoming these barriers to improve cancer diagnosis, treatment and survival.
Further national and local information
Risk factors
Risk factors for cancer broadly fall into three categories: genetic/hereditary, environmental, and lifestyle/behaviour risks. Cancer Research UK published work on the number of cancer cases in the UK that could be prevented by known lifestyle and environmental factors.4,5 The list below is taken from this work and lists factors which increase cancer risk, in order of relative impact:
-
- Tobacco - smoking any form of tobacco, or exposure to environmental tobacco smoke
- Overweight - having a BMI of 25 kg/m2 or over
- Radiation: UV (sunlight and sunbeds)
- Occupation - being exposed to cancer causing chemical or conditions at work
- Infections - exposure to cancer-causing infections like HPV and hepatitis B or C
- Alcohol - drinking of any type of alcohol
- Insufficient dietary fibre - having less than 30 grams of fibre a day
- Radiation: ionising - being exposed to any ionising radiation, including background levels such as those released from the earth
- Eating processed meat
- Air pollution
- Not breastfeeding
- Inactivity - being moderately active for less than 120 minutes a week
- Postmenopausal hormones - taking hormone replacement therapy
- Oral contraceptives
Note: factors such as oral contraception may have a net protective effect against cancers. Cancer risks for HRT and oral contraceptives are considered to be relatively low and benefits may outweigh risks.6 If you have any concerns please speak to your GP.
Cancer, Britons most feared disease
Office for Health Improvement and Disparities, Cancer Services - OHID (phe.org.uk)
Scott, Emily C.S. et al., Health inequalities in cancer care: a literature review of pathways to diagnosis in the United Kingdom. eClinicalMedicine, Volume 76, 102864
Cancer Research UK, Statistics on preventable cancer
Brown KF, Rumgay H, Dunlop C, et al. The fraction of cancer attributable to known risk factors in England, Wales, Scotland, Northern Ireland, and the UK overall in 2015. British Journal of Cancer, 2018
Cancer Research UK, Does hormone replacement therapy (HRT) increase cancer risk?