Social Care
Last Modified 24/03/2022 10:42:58
Share this page
Introduction
Some of the most vulnerable people in our society are reliant on care and extra support to help them lead better, more comfortable lives. The care and support they receive can be the difference between a life that is fulfilling and active and one which is unnecessarily limiting. Adult social care supports both older people and working age adults who have disabilities, mental health conditions or are generally frail, as well as their carers. It is personal and practical support to help people live their lives and maintain their independence, dignity and control. People can receive social care in their own homes, community settings like day centres or in places like residential care homes.
The Care Act came into force in 2015 and is a very important piece of legislation that brings together lots of care and support laws. The main features of the Care Act include promoting people's wellbeing, providing information and advice about care, supporting carers, offering choice and control over care and treating everyone equally when decisions about who gets help are made.
A recent report from the Local Government Association outlines the current pressures facing all councils on the state of funding for social care and the implications this has for services1.
Blackpool Council provides a broad range of community based services such as day care. However the majority is provided through care at home services.
Social Care - Provision of Services in Blackpool
Social care provision of services looks at the way in which resources are shaped into adult social care services and gives consideration to how the ongoing work and future challenges for available resources can be fit for current service users and future demand. The type of service offered to older people in need of social care support depends on the level of need of the potential service user.
Older people population estimates and projections
Blackpool has a larger proportion of people aged 50 and over than the national average:
- 56,300 people aged 50+, 40% of the total population
- 28,400 people aged 65+, 20% of the total population
- 13,000 people aged 75+, 9% of the total population
- At age 50+ the gender split is 48% male, 52% female. By age 75+ the gender split is 41% male, 59% female.
Figure 1: Mid-year population estimates of people aged 50+ and proportion of over 50s in total population
| | England | Blackpool |
|---|
| | Persons | Persons | Males | Females |
|---|
| | % | No. | % | No. | No. |
|---|
| All ages |
|
139,578 |
|
68,795 |
70,783 |
| 50-54 |
7.0 |
10,723 |
7.7 |
5,428 |
5,295 |
| 55-59 |
6.0 |
9,269 |
6.6 |
4,778 |
4,491 |
| 60-64 |
5.3 |
7,867 |
5.6 |
3,952 |
3,915 |
| 65-69 |
5.5 |
8,745 |
6.3 |
4,350 |
4,395 |
| 70-74 |
4.1 |
6,671 |
4.8 |
3,188 |
3,483 |
| 75-79 |
3.3 |
5,460 |
3.9 |
2,487 |
2,973 |
| 80-84 |
2.4 |
3,832 |
2.7 |
1,601 |
2,231 |
| 85-89 |
1.5 |
2,343 |
1.7 |
867 |
1,476 |
| 90+ |
0.9 |
1,396 |
1.0 |
358 |
1,038 |
| |
|
|
|
|
|
| 50+ |
36.0 |
56,306 |
40.3 |
27,009 |
29,297 |
| 65+ |
17.7 |
28,447 |
20.4 |
12,851 |
15,596 |
| 75+ |
8.1 |
13,031 |
9.3 |
5,313 |
7,718 |
| Source: ONS mid-year population estimates, 2015 |
Figure 2: Population pyramid - proportion of over 50's in Blackpool compared to the national average
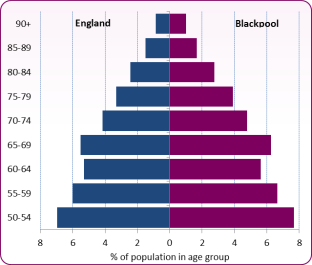 Source: ONS mid-year population estimates, 2015
Population projections suggest there will be a significant rise in the over-65 population in Blackpool, far in excess of increases in other age groups. By 2030, there will be an increase of 17% (from 28,400 to 33,200) and older people aged 65+ will make up over a quarter (26%) of Blackpool's total population. In addition, the population of people aged over 80 will grow at a faster rate, increasing over 40% from 7,600 to 10,700 by 2030.
Living status is also a useful predictor of use of services, as older people with an informal carer are more likely to remain in their own home. The number of people aged 65+ who provide unpaid care in Blackpool is projected to rise from 4,164 to 4,836 by 2030. However, the number of older people predicted to be living alone will increase by 20% from 10,500 to 12,700 by 2030 and people unable to manage at least one self-care activity on their own will increase from 9,600 to 11,9002.
Data from the 2011 Census showed the percentage of Blackpool residents whose day to day activities were limited because of a long-term health problem or disability was 25.6% (36,300), significantly higher than the national average of 17.6%. There is considerable variation across the borough; Anchorsholme ward has the largest proportion of residents with a limiting long-term health problem or disability (29.3%) compared with Marton at 19.5%; though all areas are higher than the national average. This also reflects the average age profile of the wards and highlights that disability increases with age.
The GP Patient Survey 20163 also shows that 62% of patients report having a long standing health condition and 20% state they have carer responsibilities. Nationally this is 53% and 18% respectively. Disability from multiple conditions is common.
Stroke is a major health problem commonly affecting older people. Stroke mortality rates have been falling steadily since the late 1960s, but despite improvements in mortality and morbidity, people with stroke still need access to effective rehabilitation services. Long-term morbidity is a significant problem leaving significant numbers with moderate or severe disabilities who are then dependent on others to carry out daily activities. The prevalence and hence the burden of stroke may grow in the future as a result of the increase in the proportion of older people in the society4.
-
- In 2014/15 there were 3,920 people who had been diagnosed with a stroke in Blackpool.
- This is a prevalence rate of 2.3%, significantly higher than the national average of 1.7%
- Mortality rates from stroke are significantly higher in Blackpool than the national average
- There were 228 emergency admissions for stroke in Blackpool in 2014/15, a rate of 159.1 per 100,000, slightly below the national average.
Figure 3: Trend in rates of admissions to hospital for stroke for all ages
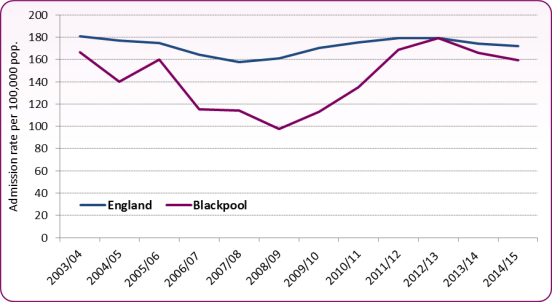 Source: PHE, Cardiovascular Disease Profiles - Stroke
Some people who have had a stroke will have complex care and rehabilitation needs following their stroke. The person and their families may require input from a number of service providers and therefore to achieve best possible outcomes joint health and care plans should be developed to ensure co-ordinated and effective care.
-
- The proportion of patients with a diagnosis of stroke who are discharged from hospital with a joint health and social care plan was 32% in Blackpool in 2014/15. This compares to 81% nationally.
Some overall facts and figures for Blackpool about people receiving social care assessments etc - to be completed
Social Care client mapping
The purpose of this mapping is to inform a number of pieces of work running in parallel:-
-
- Allocation of social worker numbers to neighbourhoods - using care homes and numbers receiving domiciliary care as a proxy for workload
- Identification of potential under usage of Vitaline and Day Care by geographical area
- Identification of high intensity areas of domiciliary care for informing the market position statement for regulated services, including potential for further development of walking route care, to support neighbourhood development and local employment. With a potential for employment and skills development through the domiciliary provider and the college.
Figure 4: Care home locations around Blackpool and care homes in relation to GP practice neighbourhoods
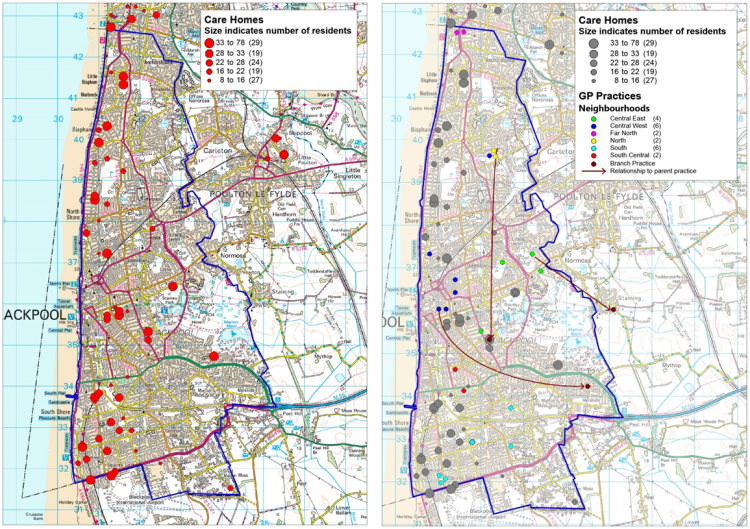 Source: Blackpool Council, Public Health Intelligence
Vitaline clients
Vitaline offers a range of services designed to help people to live independently and safely. The core business is the provision of a monitoring and response service through the use of Telecare and Telehealth technology and personal response. Vitaline also provide a Lifting Service for clients who have fallen but are uninjured and a Falls Referral service.
Figure 5: Levels of Vitaline service
| Level | Service |
|---|
| Bronze |
24 hour monitoring of community alarm, GP/Emergency services/nominated person(s) contacted as appropriate in the event of an alert, lifting service will attend if required*. |
| Silver |
24 hour monitoring of community alarm, GP/Emergency services/nominated person(s) contacted as appropriate in the event of an alert, Lifting Service will attend if required*, Mobile Response to every emergency alert, Key Holding Service. |
| Gold |
24 hour monitoring of community alarm, GP/Emergency services/nominated person(s) contacted as appropriate in the event of an alert, Lifting Service will attend if required*, Mobile Response to every emergency alert, Key Holding Service, Regular welfare checks-frequency dependant on individual need. |
| Diamond/Platinum |
24 hour monitoring of community alarm, GP/Emergency services/nominated person(s) contacted as appropriate in the event of an alert, Lifting Service will attend if required*, Mobile Response to every emergency alert, Key Holding Service, Regular welfare checks-frequency dependant on individual need, Medication Prompts by telephone or through the system depending on need. |
| *Vitaline lifting service is funded by the NHS and is currently available to all Vitaline users. |
| Source: Vitaline http://www.vitaline.org.uk/service_levels.htm |
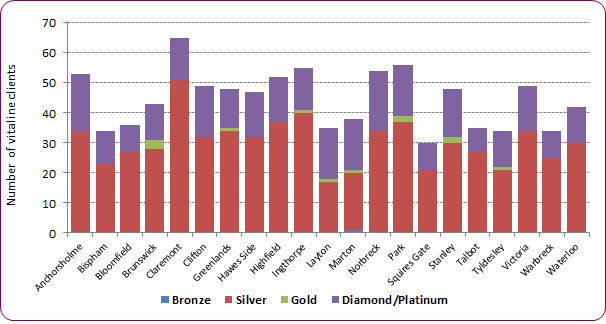
- As at September 2016 there were 937 Vitaline clients, 68% received the Silver level of service, 1% the Gold and 31% the Diamond/Platinum.
- Uptake of the service ranges from 30 in Squires Gate to 65 clients in Claremont.
- A quarter of all clients (230) come from Claremont, Ingthorpe, Norbreck and Park.
- The wards with the lowest uptake of the service are are Bispham, Squires Gate, Talbot, Tyldesley and Warbreck.
- The highest rates of clients are in Anchorsholme, Claremont, Ingthorpe and Norbreck, over 1,000 per 100,000 pop.
- Squires Gate has the lowest rate of Vitaline clients, less than 600 per 100,000 pop.
Figure 6: Number of Vitaline clients by Lower Super Output Area (LSOA), Sept 2016
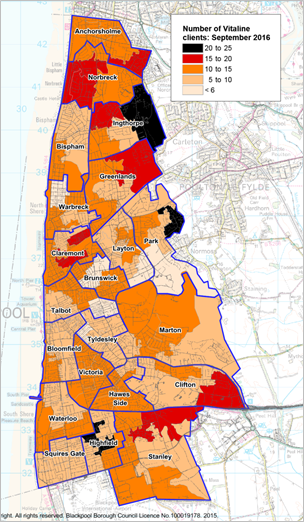 Source: Blackpool Council, Public Health Intelligence (BI Adult social care database-Framework-I)
Figure 7: Vitaline clients by service level and ward of residence, Sept 2016
 Source: Blackpool Council, Business Intelligence, Adult social care database-Framework-I
Physical Support and Memory and Cognition Support - care at home clients - definition?
Figure 8: Number of Blackpool social care clients receiving Physical Support and Memory/Cognition Support at home by ward of residence, Sept 2016
 Source: Blackpool Council, Business Intelligence, Adult social care database-Framework-I
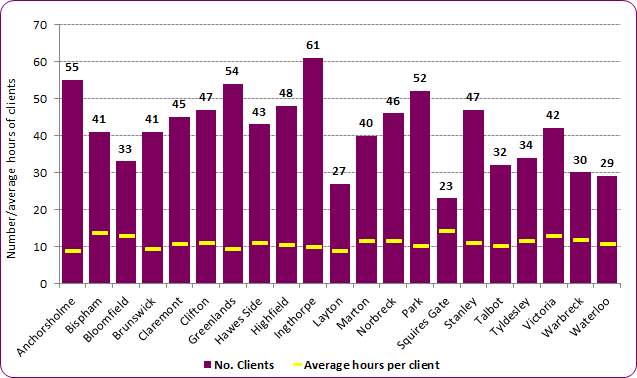
Figure 9: Physical Support and Memory/Cognition clients by ward, Sept 2016
| | Number of clients | % in ward | Hours | Average hours per client | Rate per 100,000 pop. |
|---|
| Anchorsholme |
55 |
6.3% |
491.75 |
8.9 |
1043.0 |
| Bispham |
41 |
4.7% |
565 |
13.8 |
776.4 |
| Bloomfield |
33 |
3.8% |
424.5 |
12.9 |
622.4 |
| Brunswick |
41 |
4.7% |
389.5 |
9.5 |
808.0 |
| Claremont |
45 |
5.2% |
489.25 |
10.9 |
759.6 |
| Clifton |
47 |
5.4% |
516 |
11.0 |
892.7 |
| Greenlands |
54 |
6.2% |
510.5 |
9.5 |
1005.2 |
| Hawes Side |
43 |
4.9% |
471.5 |
11.0 |
778.1 |
| Highfield |
48 |
5.5% |
498.75 |
10.4 |
918.5 |
| Ingthorpe |
61 |
7.0% |
602.75 |
9.9 |
1143.6 |
| Layton |
27 |
3.1% |
238.5 |
8.8 |
503.6 |
| Marton |
40 |
4.6% |
466 |
11.7 |
749.2 |
| Norbreck |
46 |
5.3% |
539.5 |
11.7 |
906.6 |
| Park |
52 |
6.0% |
526.5 |
10.1 |
925.6 |
| Squires Gate |
23 |
2.6% |
331.75 |
14.4 |
457.4 |
| Stanley |
47 |
5.4% |
522.5 |
11.1 |
883.8 |
| Talbot |
32 |
3.7% |
328 |
10.3 |
589.6 |
| Tyldesley |
34 |
3.9% |
398.75 |
11.7 |
651.8 |
| Victoria |
42 |
4.8% |
543 |
12.9 |
814.6 |
| Warbreck |
30 |
3.4% |
354.5 |
11.8 |
577.6 |
| Waterloo |
29 |
3.3% |
309.5 |
10.7 |
538.7 |
| Blackpool |
870 |
|
9518.5 |
10.9 |
778.9 |
| Source: Blackpool Council, Business Intelligence, Adult social care database-Framework-I |
-
- As at Sept 2016 there were 870 Physical Support and Memory and Cognition clients.
- Overall, 25.2% (222) were in Anchorsholme, Greenlands, Ingthorpe and Park.
- These wards also had the highest rates per 100,000 population.
- Rates ranged from 457 per 100,000 in Squires Gate to 1,143 in Ingthorpe.
- Average hours of care per client ranges from 8.8 hours in Layton to 14.4 hours in Squires Gate.
- While Squires Gate has the lowest number of clients, they have the highest average number of hours per client.
- Ingthorpe has the highest number of clients but the 5th lowest average number of hours.
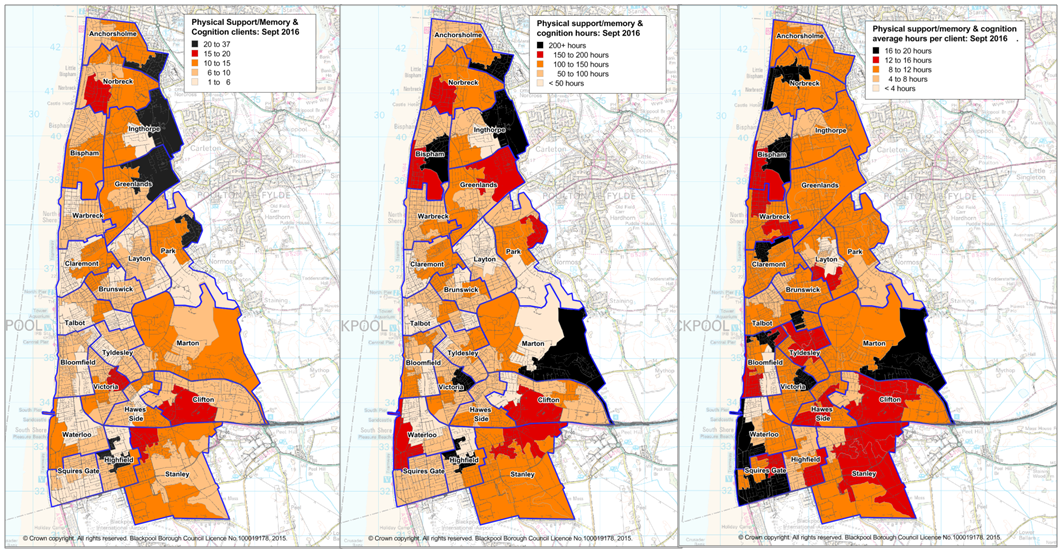
Figure 10: Physical Support and Memory/Cognition care at home - clients, hours and average hours by LSOA, Sept 2016
 Source: Blackpool Council, Public Health Intelligence (BI Adult social care database-Framework-I)
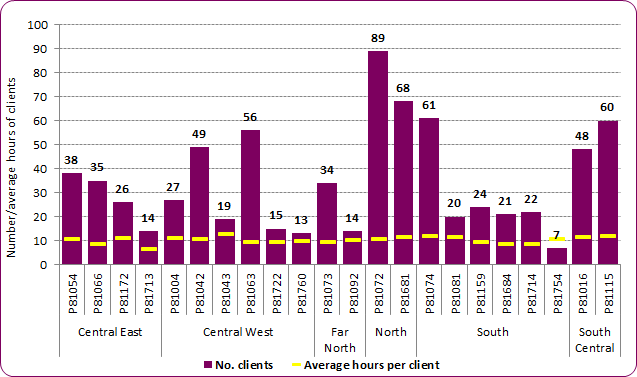
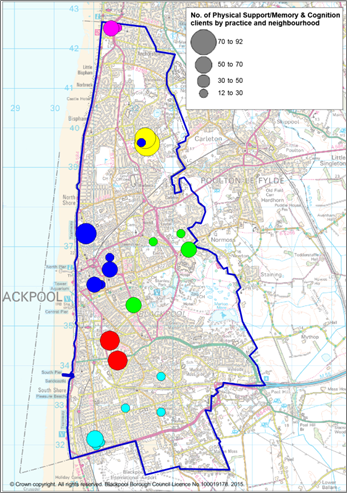
Figure 11: Physical Support and Memory/Cognition clients by GP practice and neighbourhood - number and average hours, Sept 2016
 Source: Blackpool Council, Business Intelligence, Adult social care database-Framework-I
-
- The average number of hours per client for personal support and memory and cognition across Blackpool is 10.9 hrs
- This ranges from 6.8 hours per client in P81713 (Central East) to 12.8 hours per client in P81043 (Central West).
- South Central which included two practices has the highest average number of hours per client at 11.9 hours.
- Central East, with four practices, has the lowest average hours per client with 9.8 hours
-
- Over a fifth (21%) of personal support and memory and cognition clients are registered with the Central West practices
- Central West also has the highest proportion of Vitaline clients
- The Far North neighbourhood has the fewest number of clients using Blackpool's care at home services
Figure 12: Physical Support and Memory/Cognition clients by GP practice and neighbourhood
 Source: Blackpool Council, Public Health Intelligence (BI Adult social care database-Framework-I)
Day Care clients - definition??
Definition of day care ? what and who?
- There are approximately 240 day care clients across Blackpool, the highest proportion (7.4%) are in Victoria.
- Ingthorpe and Victoria have over 40 day care days per week
- Across Blackpool the average number of days of day care per client is 2.3
- Highfield records the lowest rate of day care, <5 clients and <5 days per week
- Bloomfield has the highest rate of day care in the town
Figure 13: Day care clients by ward, Sept 2016
| | Number of day care clients | % of day care clients | Day care - days | Average days per client |
|---|
| Anchorsholme |
15 |
6.2% |
35 |
2.3 |
| Bispham |
14 |
5.8% |
28 |
2.0 |
| Bloomfield |
6 |
2.5% |
18 |
3.0 |
| Brunswick |
14 |
5.8% |
37 |
2.6 |
| Claremont |
<10 |
<4% |
19 |
<3.0 |
| Clifton |
16 |
6.6% |
38.5 |
2.4 |
| Greenlands |
15 |
6.2% |
35 |
2.3 |
| Hawes Side |
16 |
6.6% |
35 |
2.2 |
| Highfield |
<5 |
<1% |
<5 |
<2.0 |
| Ingthorpe |
16 |
6.6% |
46 |
2.9 |
| Layton |
9 |
3.7% |
17 |
1.9 |
| Marton |
12 |
5.0% |
27 |
2.3 |
| Norbreck |
<10 |
<4% |
23 |
<3.0 |
| Park |
13 |
5.4% |
27 |
2.1 |
| Squires Gate |
10 |
4.1% |
19 |
1.9 |
| Stanley |
10 |
4.1% |
17 |
1.7 |
| Talbot |
10 |
4.1% |
28 |
2.8 |
| Tyldesley |
10 |
4.1% |
21 |
2.1 |
| Victoria |
18 |
7.4% |
44 |
2.4 |
| Warbreck |
10 |
4.5% |
22 |
2.0 |
| Waterloo |
10 |
4.1% |
19 |
1.9 |
| Blackpool |
242 |
|
556.5 |
2.3 |
| Source: Blackpool Council, Business Intelligence, Adult social care database-Framework-I |
Figure 14: Day Care - clients, days per week and average days per week by LSOA, Sept 2016
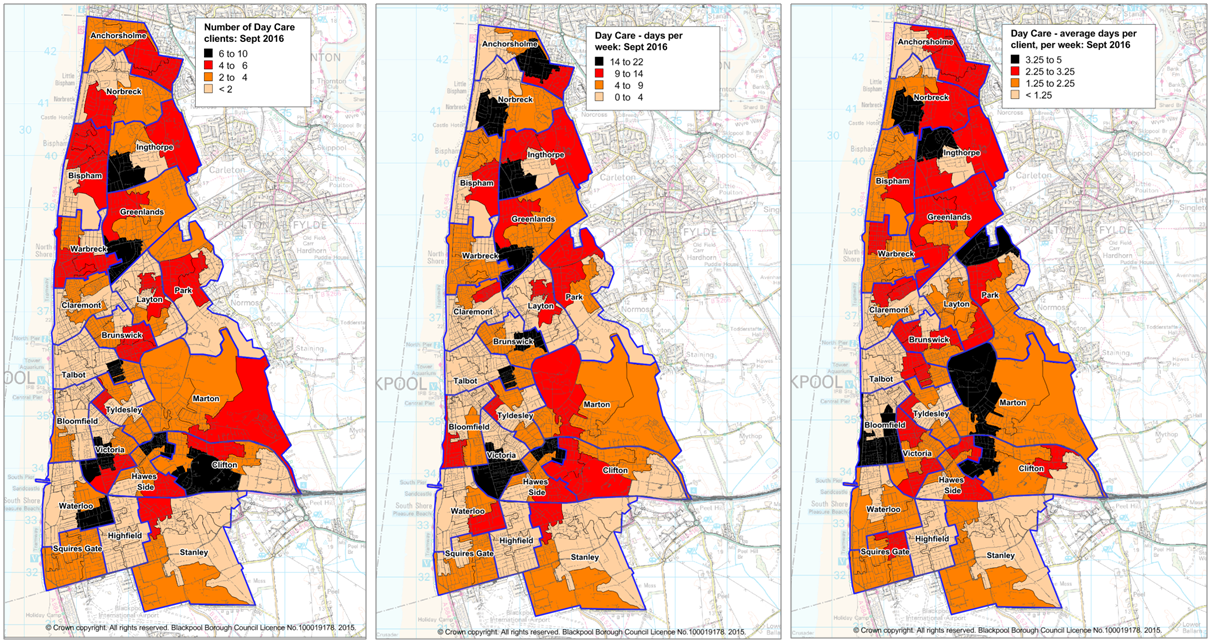 Source: Blackpool Council, Public Health Intelligence (BI Adult social care database-Framework-I)
National and local strategies and guidance
Blackpool Council Adult Contracts and Commissioning Market Position Statement 2014 presents a picture of care at home demand and supply, what that might look like in the future and how strategic commissioners will support and develop the local market.
Statutory guidance to support implementation of part 1 of the Care Act 2014 by local authorities
NICE guideline [NG22] Older people with social care needs and multiple long-term conditions (Nov 2015) covers planning and delivering social care and support for older people who have multiple long-term conditions.
[] Local Government Association, Adult social care funding: 2016 state of the nation report. November 2016
[] POPPI-Projecting Older People Population Information System
[] NHS England, GP Patient Survey
[] NICE guidelines [CG162] Stroke rehabilitation in adults, June 2013