Children with Learning Disabilities and Special Educational Needs
Last Modified 29/03/2023 10:42:28
Share this page
SEND Needs Assessment: February 2022

The Blackpool SEND Partnership Board completed an up to date SEND Needs Assessment in February 2022.
Contents
Introduction
Identified SEND among Blackpool's children and young people
Primary type of need
Demographics of young people with SEND
Meeting the needs of young people with SEN
Summary and Recommendations
References
Background
SEND (Special Educational Needs and Disability) is a term used to describe a learning difficulty or disability that means a child or young person needs additional health and education support. The nature and causes of learning difficulties and disabilities vary greatly and mean that children with SEN can require a range of differing support to manage their learning, behaviour, physical health needs, emotional health needs and educational outcomes.
Special Educational Needs and Disability (SEND) Reforms
Following the introduction of the Children and Families Act 2014, the way in which education, local authorities, health and social care services provide support to children and young people with SEND has changed. The SEND Code of Practice 2015 was subsequently published by the Department of Health and the Department of Education to reflect changes introduced by this Act.
The two main changes in SEND provision introduced by these reforms were:
-
- Support was extended to cover children and young people between the ages of 0 and 25 instead of covering only compulsory school age children
- The re-categorisation of support and assessment (see below)
SEN (Special Educational Needs) Support
SEN support describes support given to pupils with SEN that is additional or different to that provided as part of the school’s usual curriculum. This is initiated by schools and parents must be notified if it is decided their child needs SEN support. Parents should be involved in discussions around what support, adjustments and interventions are to be put in place. This can include outside specialists providing advice and support to teachers and the special educational needs coordinator. Students receiving SEN support do not have an education health and care plan (EHCP) in place. SEN support replaces the previously used categories of School Action and School Action Plus.
Education, health and care plans (EHCPs)
Education, health and care plans (EHCPs) have been brought in to replace statements. To obtain an EHCP, a child or young person must be referred to their local authority for a needs assessment. This can be done upon the request of the child’s parents, the young person themselves or the educational institution such as early years setting, school or college. Not all children with SEN require an EHCP. A needs assessment request is more likely to happen where SEN support currently being provided by their early years setting, school or college, from its own resources, is not enabling the child or young person to make adequate progress. After the needs assessment has taken place, if required, an EHCP will be created which outlines what the child or young person’s need is, what outcomes are sought and what extra help they need to receive.
The Code of Practice also provides guidance on joint planning and commissioning of services to ensure cooperation between education, health and social care providers. As well as providing individuals with EHCPs, local authorities also commission local services called a “local offer” and work with the clinical commissioning group, parents, children and other services to agree shared outcomes and plan services. This process is informed by this needs assessment and our SEND strategy.
Figure 1: The relationship between population needs, commissioning and individual EHC plans
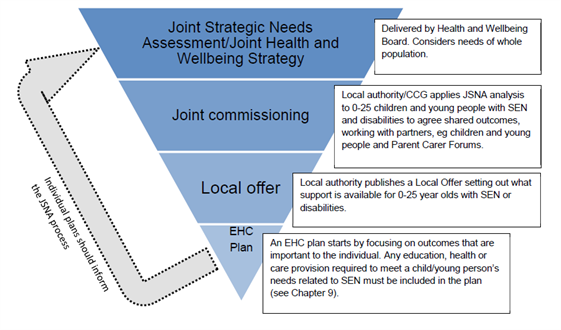 Source: DfE, Special educational needs and disability code of practice: 0 to 25 years, January 2015
Educational settings
Children with special educational needs are educated in a variety of different settings. Some children will be educated in mainstream primary and secondary schools, others may attend maintained special schools which are funded by the local authority. In addition to this, some children are educated in independent, non-maintained schools. This can pose a challenge when gathering information about special educational needs as these settings are often not included in national data. Consideration must also be taken as to the location of children’s schooling as some children may travel outside of Blackpool for their education and some may come into Blackpool schools from other areas.
Similar local authorities
When analysing data about SEND in Blackpool, we have compared this to similar local authorities (LAs). This has been done using the DfE recognised National Foundation for Educational Research (NFER) statistical neighbour model. This creates a list of 10 local authorities which are most similar to Blackpool in their demographics. Blackpool’s nearest statistical neighbours using this model are Halton, Hartlepool, Kingston Upon Hull, Knowsley, Middlesbrough, North East Lincolnshire, Redcar and Cleveland, South Tyneside, Stoke-on-Trent and Tameside.
To examine the identified SEN in young people at both a local and national level we can look at the number of the children and young people receiving SEN support and children and young people with an EHCP.
This report draws on SEND data from several key sources:
-
- The DfE’s ‘Special educational needs in England’ reports use annual school census data to examine SEN in the school age population. Reports include data regarding SEN support and EHCPs from state-funded nursery, primary, secondary and special schools, non-maintained special schools and pupil referral units. Sixth forms are included in these figures, however other further education institutions such as colleges are not. It is also worth noting that children in special schools can continue their education, dependent on need, past the age of 16, often up to ages of 18/19 years old within the special school itself. Only some categories include data from independent schools.
- The DfE’s ‘Education Health and Care Plans’ annual reports use data from the SEN2 return. This is made up of information provided by local authorities on all children and young people aged 0-25 with an EHCP in place.
- Blackpool Council’s EMS/ONE electronic data system provides real time data about the EHCP and SEN population in Blackpool.
EHCPs
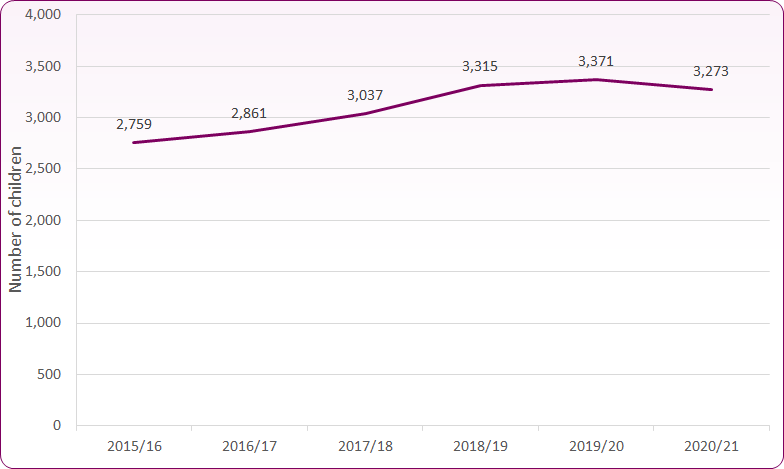
The DfE states that in 2021 there are currently 1,206 children and young people between the ages of 0-25 in Blackpool with an EHCP in place. The number of EHCPs has been rising since 2015 and has more than doubled since this time (figure 2).
Figure 2: Number of children and young people in Blackpool with an EHCP, 2010-21
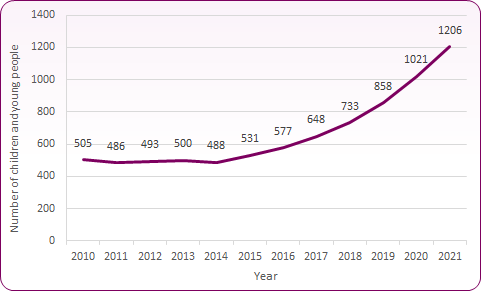
Source: DfE, Education, Health and Care Plans, 2021
To examine how EHCPs in Blackpool compare to other areas we can look at the rates of EHCPs per 10,000 children and young people, as shown in figure 3. Prior to 2015, Blackpool had relatively low numbers of EHCPs. Between 2015 and 2018 EHCPs increased in line with national and regional rates, before increasing more rapidly between 2019 and 2021.
Figure 3: Trend in EHCPs, 2010 to 2021, rate per 10,000 population
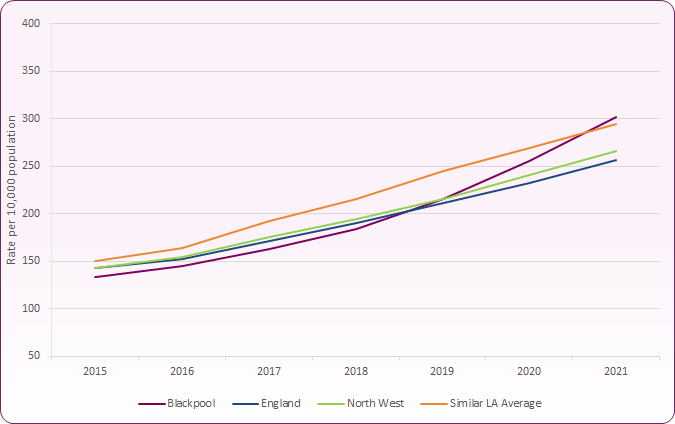
Source: DfE, Education, Health and Care Plans (SEN2 Return), 2021
As demonstrated in figure 3, the number of EHCPs per 10,000 children and young people has been rising not only in Blackpool but across England since 2015. One reason for this is that under the reforms in SEN provision in 2015, children and young people may continue to have an EHCP up until the age of 25 rather than only keeping this through compulsory school education years. The reforms also led to an increased national focus on, and refresh of, identifying the needs of those with SEND, and with it a more coordinated approach to assessment.
Prior to 2018, the number of EHCPs in Blackpool was very low compared to similar local authorities, regional and national averages. Since this time EHCP prevalence in Blackpool has increased comparatively and is now in line with similar local authorities with a rate of 302 EHCPs per 10,000 children and young people aged 0-25 in our population.
Age
Figure 4: Number of Blackpool children and young people with EHCPs by age, 2021
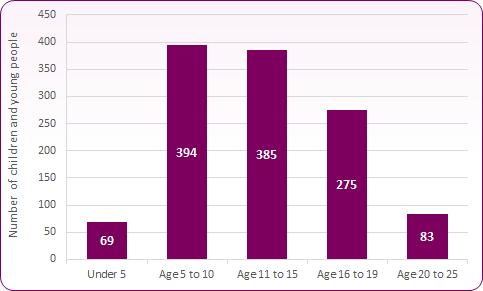 Source: DfE, Education, Health and Care Plans, 2021
In Blackpool the majority of children and young people with EHCPs are currently of primary and secondary school age. There are 394 children aged 5-10 with EHCPs and 385 children aged 11-15. There are 358 children and young people aged 16 and over with an EHCP.
Figure 5: New EHCPs introduced between 2015 and 2020, rate per 10,000 children and young people, by age
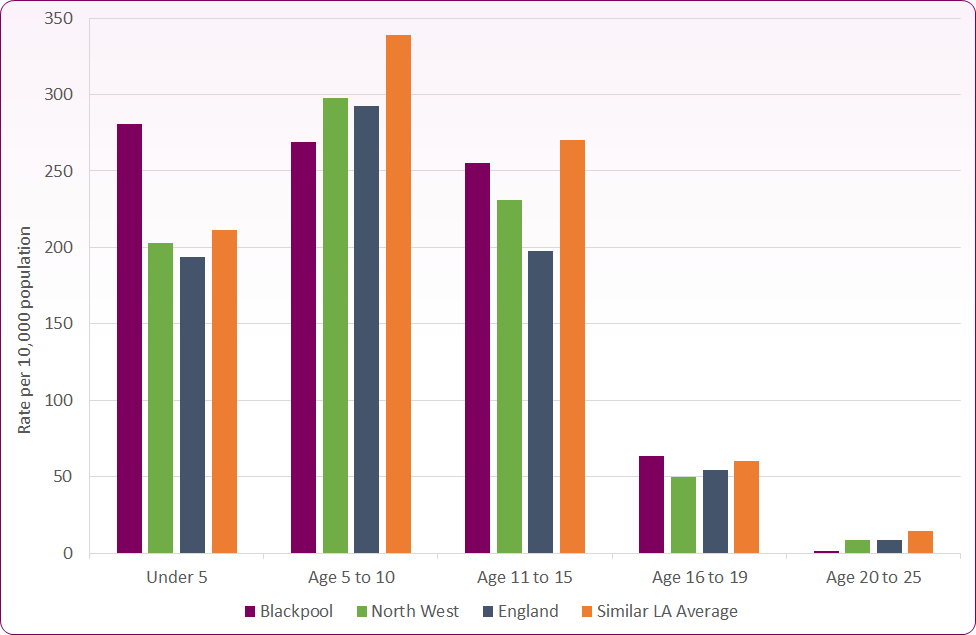 Source: DfE, Education, Health and Care Plans, 2021
Figure 5 examines the age at which new EHCPs have been introduced in children and young people between 2015 and 2020. These are displayed as rates per 10,000 children and young people to allow comparison to other areas.
-
- Over the past five years Blackpool has introduced considerably more EHCPs in children under the age of five than both similar LA and national averages.
- The rate for new EHCPs in both primary and secondary school age children has been lower than the average in similar local authorities. This is likely to have been offset somewhat by the high numbers of EHCPs in children under five.
- For young people aged 16 and over the amount of new EHCPs is lower than what we see in younger children both locally and nationally. In young people aged 16 to 19, the number of new EHCPs in Blackpool is in line with numbers seen in similar LAs.
- There are very few new EHCPs in young people aged 20-25 in Blackpool when compared to national and similar LA EHCP rates.
Educational Settings
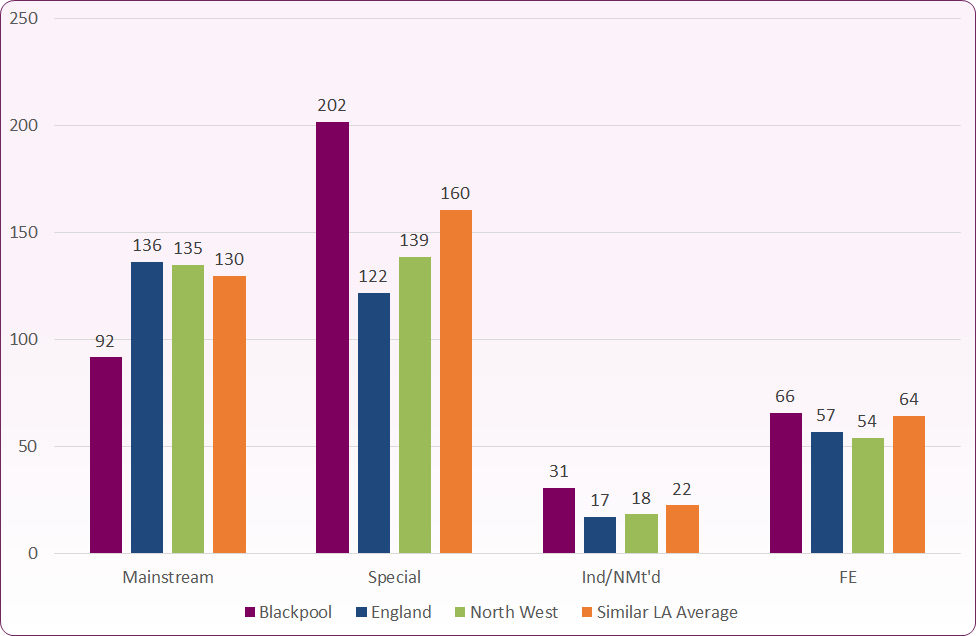
Figure 6: Rates of EHCPs per 10,000 children and young people (aged 0-19) across educational settings in 2021
 Source: DfE Education, Health and Care Plans, 2021
Figure 6 examines the number of children with EHCPs educated across different types of educational institutions, displayed as a rate per 10,000 children and young people aged 0-19 to allow comparison.
-
- Despite having little difference in overall EHCP rates per 10,000 children and young people, Blackpool has considerably fewer children and young people in with EHCPs mainstream education than similar local authorities.
- There is a rate of 202 children and young people with EHCPs per 10,000 aged 0-19s in special schools. This is much higher than similar local authority, regional and national averages.
- Blackpool also has a high rate of children with EHCPs in independent non-maintained special schools. This is 40% higher than that seen in similar local authorities.
- The prevalence of young people with EHCPs in further education in Blackpool is in line with that seen in similar local authorities. This is slightly higher than regional and national levels.
Source: DfE, Education, Health and Care Plans, 2021
-
- There has been high use of independent special schools in Blackpool for a decade or longer. This increased markedly between 2016 and 2018 before steadying a little between 2018 and 2021.
- Use of Maintained Special Schools in Blackpool was in line with similar authorities in 2016 but increased significantly between 2016 and 2018. This continues to rise faster than similar local authorities and is currently at a 25% higher rate.
- Placement of children with EHCPs in mainstream primary and secondary schools has been consistently comparatively low but fell in the middle of the last decade and did not begin to narrow the gap to similar authorities until the 2019-21 period – it remains at only 70% of the rate in similar local authorities.
SEN Support
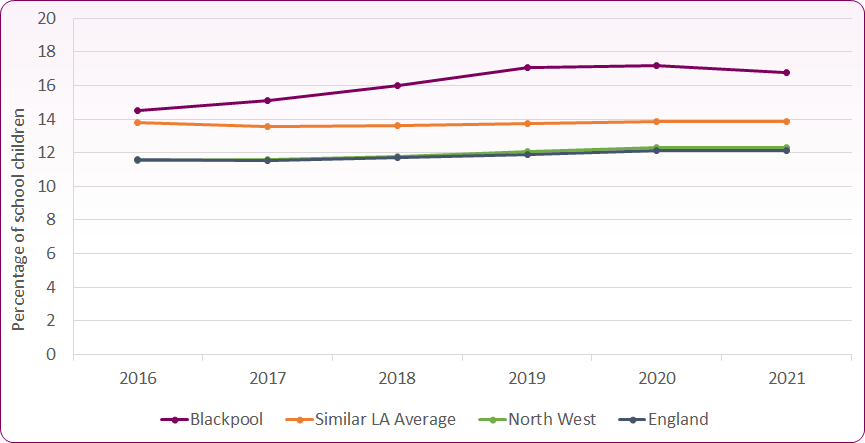
Children receiving SEN support in Blackpool schools can be assessed from school census data. This states that in Blackpool in 20/21 there are 3,273 children and young people in schools receiving SEN support. This represents 16.8% of Blackpool’s school population. This compares to 13.9%, 12.3% and 12.2% in similar local authorities, the North West and England respectively (figure 8).
Figure 8: Percentage of school children receiving SEN support, 2016 to 2021
 Source: DfES, Special Educational Needs in England
-
- In 2016 the percentage of children in Blackpool schools with SEN support was only slightly higher than that seen in similar local authorities. This was however, higher than the levels seen regionally and nationally.
- From 2016 to 2019, the percentage of children with SEN support in Blackpool continued to increase, whilst similar local authority, regional and national levels remained relatively static.
Figure 9: Numbers of children receiving SEN support in Blackpool schools, 2020/21
 Source: DfE, Special Educational Needs in England, 2021
The identified needs of children with SEN vary greatly and are generally thought of as following four broad areas of need and support:
-
- Communication and interaction - These children and young people may have speech, language and communication needs (SLCN) that make it difficult to communicate effectively with others. This may include difficulty understanding, difficulty processing the social norms and cues of communication or difficulty in communicating their wants and needs. Children with Autistic Spectrum Condition are likely to have difficulty in navigating social interactions and can also have difficulties with speech, language and communication.
- Cognition and learning - Children and young people are said to have learning difficulties when they learn at a slower pace than their peers, even with appropriate differentiation. The level of identified need and support within learning difficulties is vast and encompasses moderate learning difficulties (MLD), severe learning difficulties (SLD), profound and multiple learning difficulties (PMLD) and also specific learning difficulties (SpLD). Those with severe learning difficulties are likely to need support across the whole school curriculum and may have associated difficulties with communication and mobility. In PMLD learning needs are severe and complex and children are likely to have a physical disability or sensory impairment. Specific learning difficulties are needs which affect specific aspects of learning and may include conditions such as dyslexia, dyscalculia and dyspraxia.
- Social, emotional and mental health difficulties - This classification of need was introduced in 2015 when the previous area of ‘Behaviour, emotional and social difficulties (BESD)’ was removed, though it was not intended to be a direct replacement. Social, emotional and mental health difficulties encompasses a range of social and emotional difficulties experienced by young people which can manifest in many ways including challenging or disruptive behaviour, or becoming withdrawn and isolated. Underlying reasons for this behaviour may include mental health difficulties such as anxiety and depression, substance misuse, self-harm, eating disorders and medically unexplained physical symptoms. In some children and young people there may be specific conditions or disorders contributing to these difficulties such as attention deficit disorder, attention deficit hyperactivity disorder or attachment disorder.
- Sensory and/or physical needs - Children and young people with these needs have a physical disability or sensory impairment which hinders or prevents them from being able to fully access the educational facilities and provisions usually provided. This may include visual impairment, hearing impairment and physical disabilities which require additional support and equipment to allow them to access the opportunities available to their peers.
Upon assessment for SEN support or an EHCP, the needs of the child or young person are assessed and a primary need from the above categories is identified. There may also be additional secondary needs recorded. Identification of needs can be subject to variation between practitioners, areas and over time and this is worth noting when interpreting underlying reasons for variations and trends between areas.
The number of children with each type of identified primary need in Blackpool schools can be seen in the chart below. (Totals include state-funded nursery, primary, secondary and special schools, non-maintained special schools and pupil referral units. Independent schools are not included).
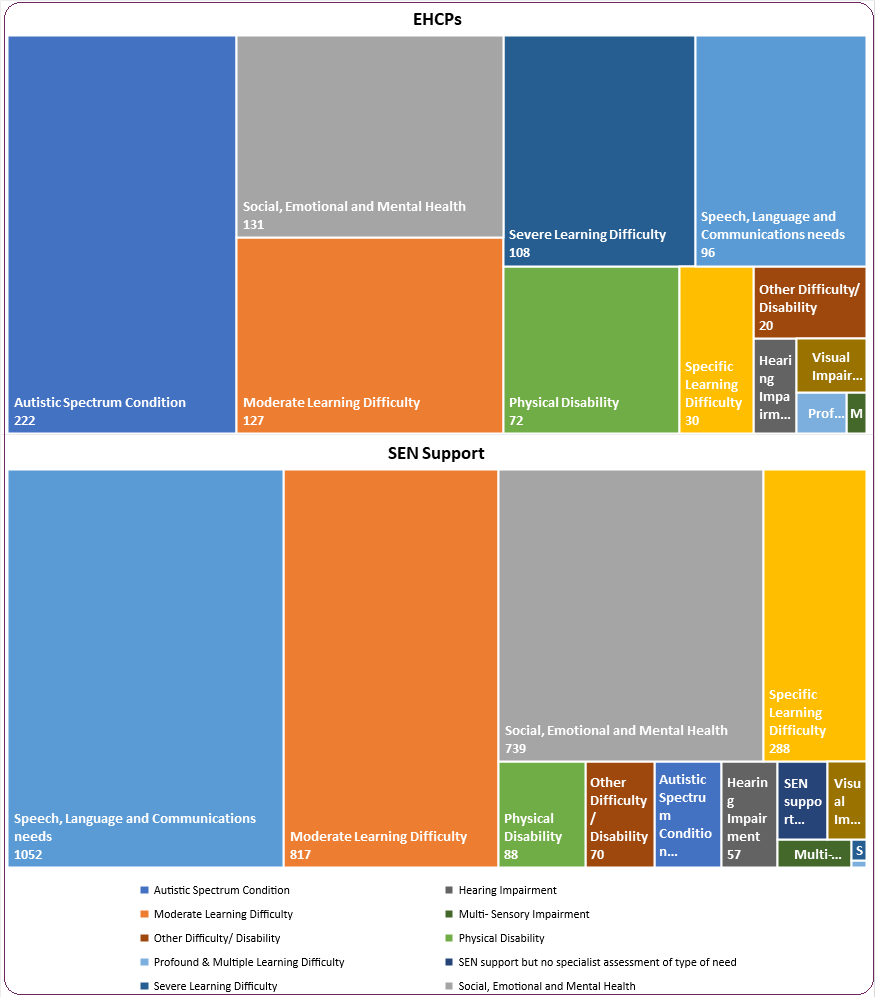
Figure 10: Number and proportion of Blackpool children and young people with ECHPs and SEN Support by identified primary need 2021
 Source: DfE, Special Educational Needs in England, 2021
-
- The most common type of need among pupils with an EHC plan is Autistic Spectrum Condition, followed by Social, Emotional and Mental Health, and Moderate Learning Difficulties. The most common type of need among pupils with SEN Support is Speech, Language and Communication needs followed by Moderate Learning Difficulty then Social, Emotional and Mental Health Needs. This is similar to the national picture, though Speech, Language and Communication Needs is the second most common need among pupils with EHCPs nationally and only the fifth most common in Blackpool.
- In Blackpool there are a total of 1,148 children and young people with speech, language and communication needs, representing 28% of Blackpool’s children and young people with SEN.
To better understand identified primary needs in Blackpool, we can examine the rates of EHCPs and SEN support per 10,000 children and young people for the various identified primary needs in Blackpool schools and how this compares to rates in other areas. These can be seen in the below tables. Higher prevalence of an identified primary need compared to similar local authorities, or compared to a previous point in time, is represented by boxes shaded in orange and lower prevalence of an identified primary need by boxes shaded in purple.
EHCPs
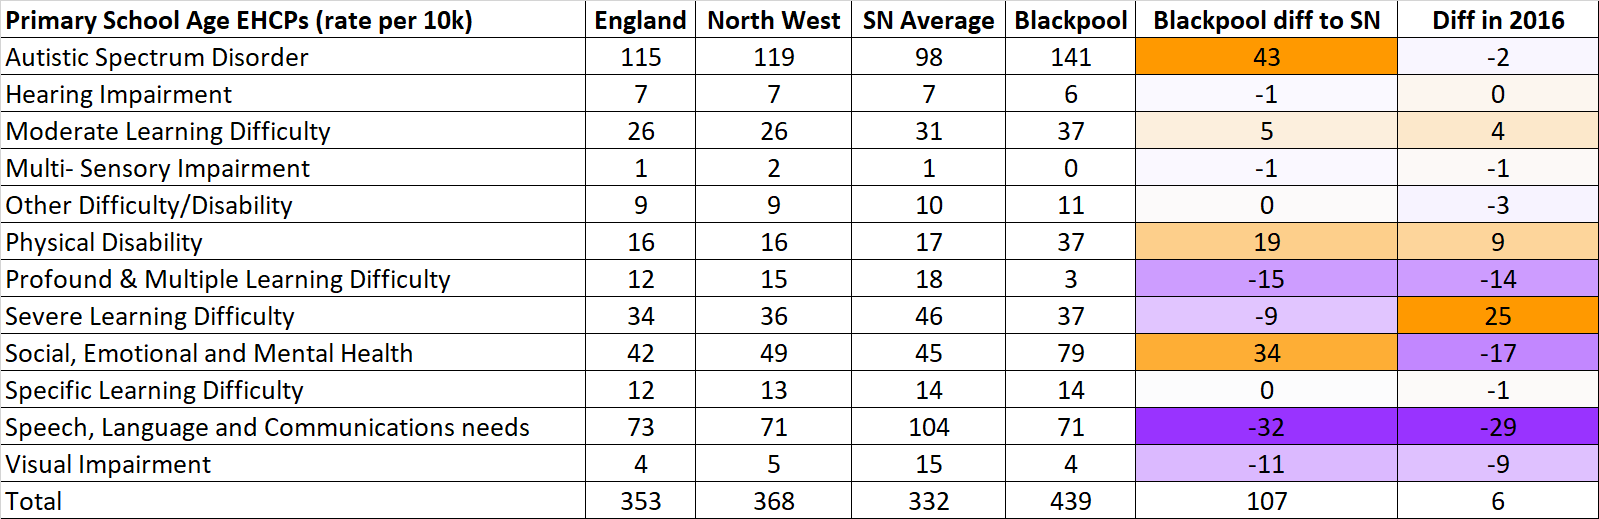
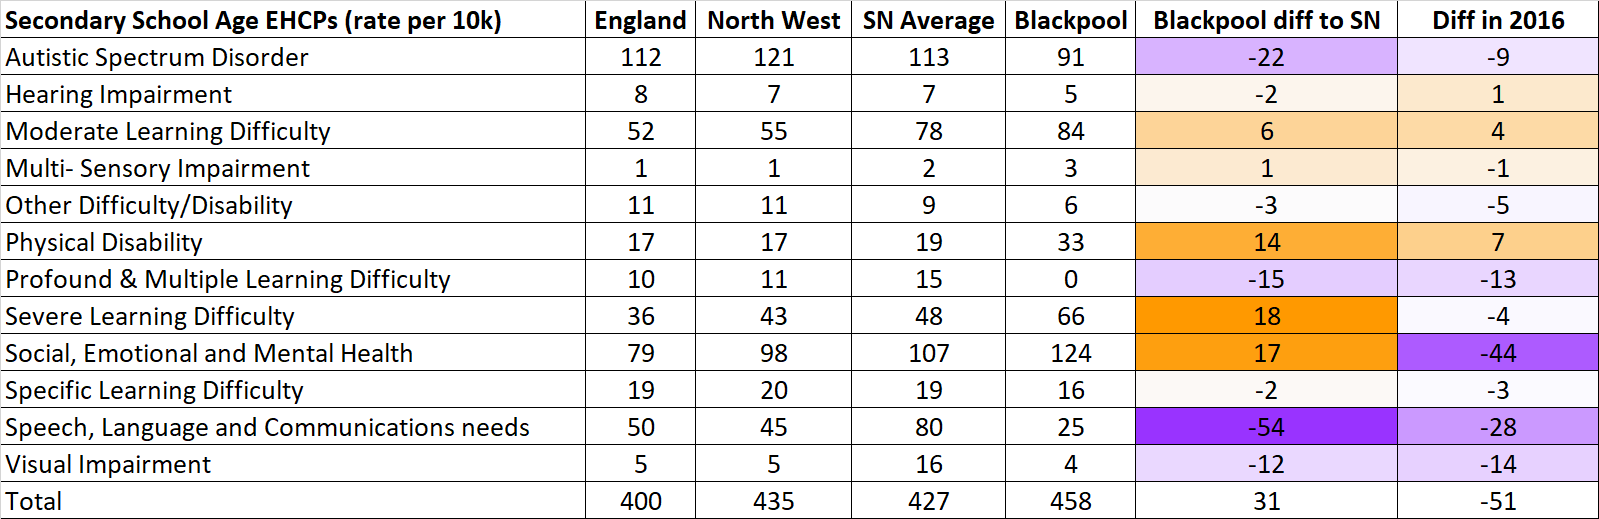
Figure 11: Rate (per 10,000) of children and young people with EHCPs, by schooling phase and primary need, 2020/2021
 Source: DfE, Special Educational Needs in England, 2021
- Blackpool has a high rate of EHCPs for Autistic Spectrum Condition (ASC) in primary school children, however there is a low rate of EHCPs for ASC in secondary school children which has been falling further behind regional and national trends.
- Blackpool has had a consistently low incidence of EHCPs for profound and multiple learning disability, visual impairment, and speech, language and communications needs.ECHPs for social, emotional and mental health (SEMH) have a high incidence in Blackpool in both primary and secondary school ages compared to similar local authorities, regional and national trends.
- Blackpool has comparatively high levels of EHCPs for physical disability in both primary and secondary school ages.
SEN Support
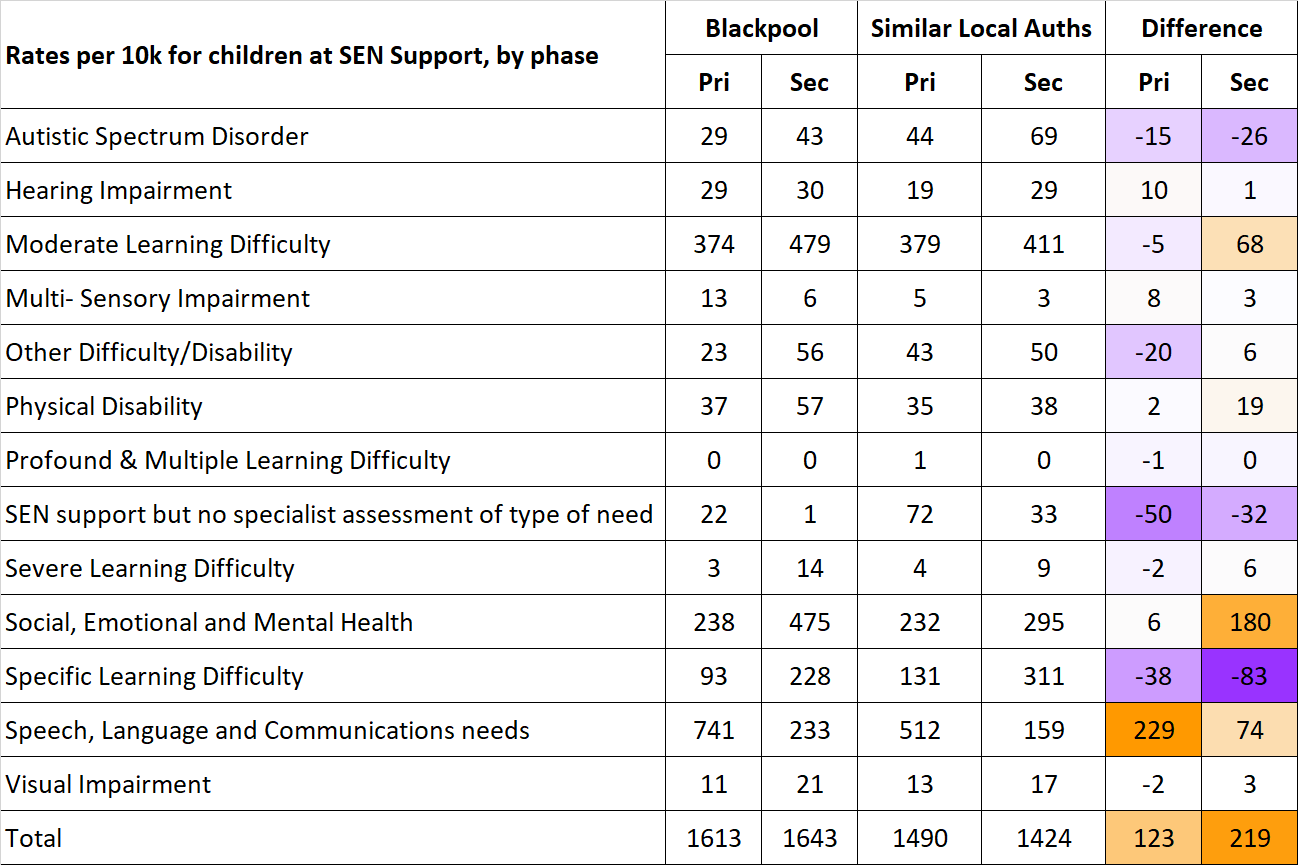
Figure 12: Rate (per 10,000) of children and young people receiving SEN support, by schooling phase and identified primary need, 2020/2021
Source: DfE, Special Educational Needs in England, 2021
- Blackpool schools identify a significantly higher number of children requiring SEN support than schools in similar local authorities.
- Blackpool has much higher incidence of SEN support for Speech, Language and Communication Needs (SLCN) in primary schools than similar local authorities. There is also considerably higher SEN support for SLCN in Blackpool secondary schools than similar local authorities, however, not to the same extent as seen in primary schools.
- In Blackpool secondary schools there is also significantly higher incidence of SEN support for moderate learning difficulty, and SEMH.
- There is low identification of Autism Spectrum Condition at SEN support level in both primary and secondary schools in Blackpool. This is in line with similarly low EHCP incidence in Blackpool secondary schools but is a stark contrast to the high incidence of EHCPs for ASC in Blackpool primary schools.
- Since 2016 there has been a readjustment in the needs identified by schools for SEN support, away from MLD and towards SLCN. This is true not only for Blackpool but is a trend seen both regionally and nationally.
- Since 2016 there has been a reduction in identified SEN support needs in Blackpool primary schools and a large increase in identified SEN support needs in Blackpool secondary schools. These trends are mirrored by regional and national changes.
Gender
Figure 13: Gender of children and young people with an EHCP in Blackpool (aged 0-25) compared to those in England schools, 2021
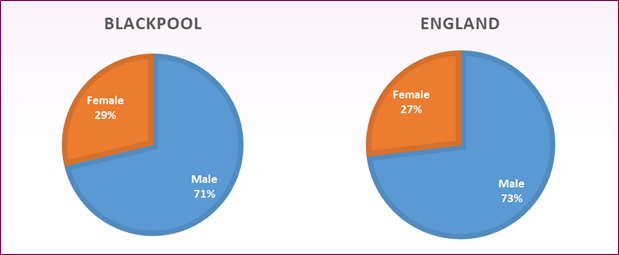 Sources: EMS/ONE, Blackpool Council. Data retrieved 07/09/2021 and DfE, Special Educational needs in England, 2021
-
- There are 893 males and 360 females with EHCPs in Blackpool, making the cohort 71% male. This is in line with figures for England and has been steady for a number of years.
Figure 14: Children and young people in Blackpool schools receiving SEN support, by gender, 2020/21
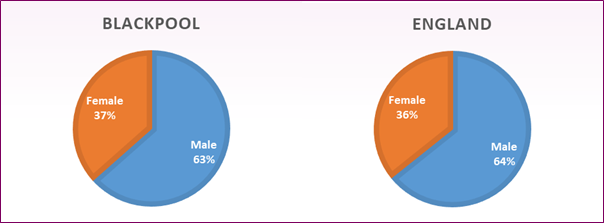 Source: DfE, Special Educational Needs, 2021
There are currently 2,073 males and 1,197 females receiving SEN support at Blackpool schools. This gives a SEN support population of 37% female and 63% male which is in line with figures for England. There has been a consistently higher proportion of males with SEN support in schools compared to females in both Blackpool and England for a number of years.
Ethnicity
Figure 15: Recorded ethnicity of Blackpool children and young people with EHCPs and SEN support, compared to total Blackpool school population, 2020/21
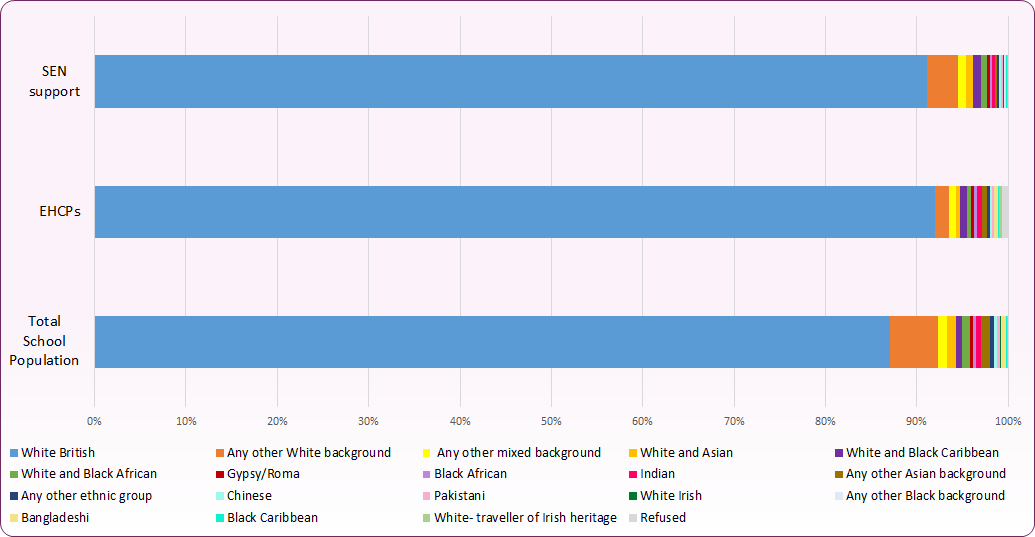 Sources: EMS/ONE, Blackpool Council. Data retrieved 07/09/2021 and DfE, Special Educational needs in England, 2021. Note: The categories ‘information not yet obtained’ and ‘unclassified’ has been omitted from analysis in order to aid comparisons. Ethnicity information was not yet obtained or unclassified for 6.7% (n=84) of all those with EHCPs compared to 0.6% of those with SEN Support and 0.4% of the total school population.
Out of Blackpool’s children and young people with EHCPs, 85.9% are white British (1076 children and young people). 90.6% of children and young people receiving SEN support are White British (2,691 children and young people). This is reflective of ethnicity in Blackpool’s school population as a whole which is 86.7% white British.
Indices of Multiple Deprivation (IMD)
The level of deprivation across different areas of England can be assessed using the government’s Index of Multiple Deprivation. This uses income, employment, education, health, crime, housing and environmental information to rank neighbourhoods (also called lower-layer Super Output Areas or LSOAs) across England according to how deprived they are. The different neighbourhoods can then be grouped into deciles to get a picture of deprivation across local authorities like Blackpool.
The 2019 index ranks Blackpool as the most deprived of 317 local authorities in England. 39 out of 94 LSOAs in Blackpool are in the 10% most deprived in the country (decile 1).
Figure 16 compares the deprivation deciles of children with EHCPs to the proportion of Blackpool LSOAs in each deprivation decile.
Figure 16: Proportion of children and young people in Blackpool with EHCPs, by deprivation decile, 2021 compared to proportion of Blackpool LSOAs in each deprivation decile, 2019
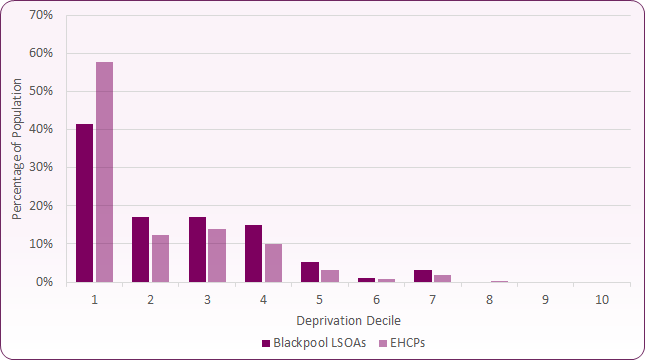 Sources: EMS/ONE, Blackpool Council. Data retrieved 07/09/2021 and Indices of Deprivation, Department for Communities and Local Government, 2019
In context of Blackpool’s high levels of deprivation the majority of children and young people with EHCPs in Blackpool live in LSOAs within the top 50% most deprived deciles. There are 684 children and young people within the most deprived decile, representing 57.8% of Blackpool’s population of children and young people with EHCPs with recorded deprivation information.
Geographical distribution of SEN across Blackpool
A more detailed examination of the proportion of school-aged children with EHCPs or in receipt of SEN Support across Blackpool shows an association between areas of high deprivation and higher levels of SEND (figure 17).
Figure 17: Map of SEN Support or EHCPs in Blackpool compared to areas of deprivation
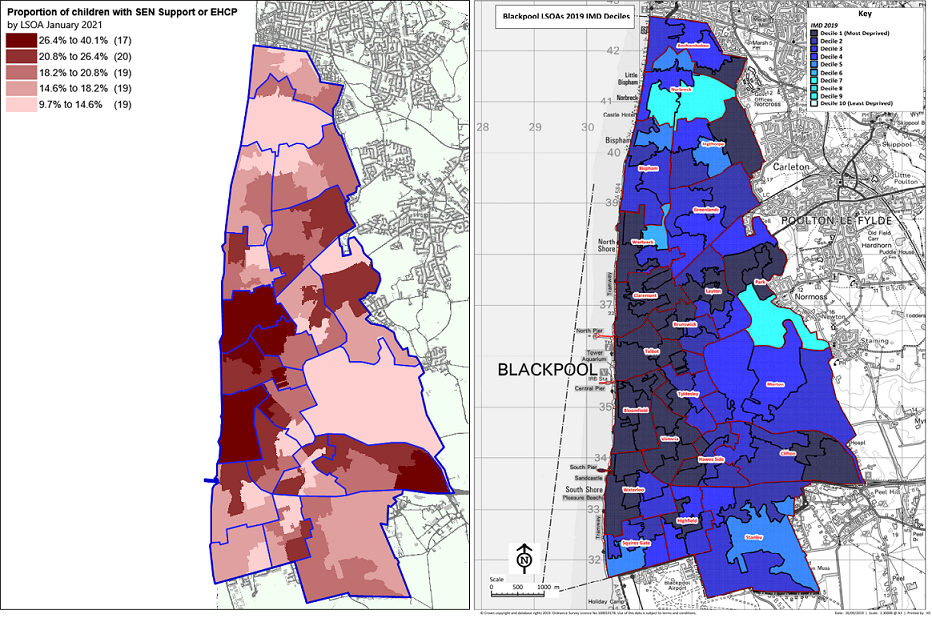 Source: DfE School Census, 2021; Blackpool LSOAs IMD Deciles, 2019
When comparing proportions of EHCPs and SEN Support separately, the relationship with deprivation remains apparent, though there are variations, particularly in relation to EHCPs (figure 18).
Figure 18: Maps of SEN Support and EHCPs in Blackpool, January 2021
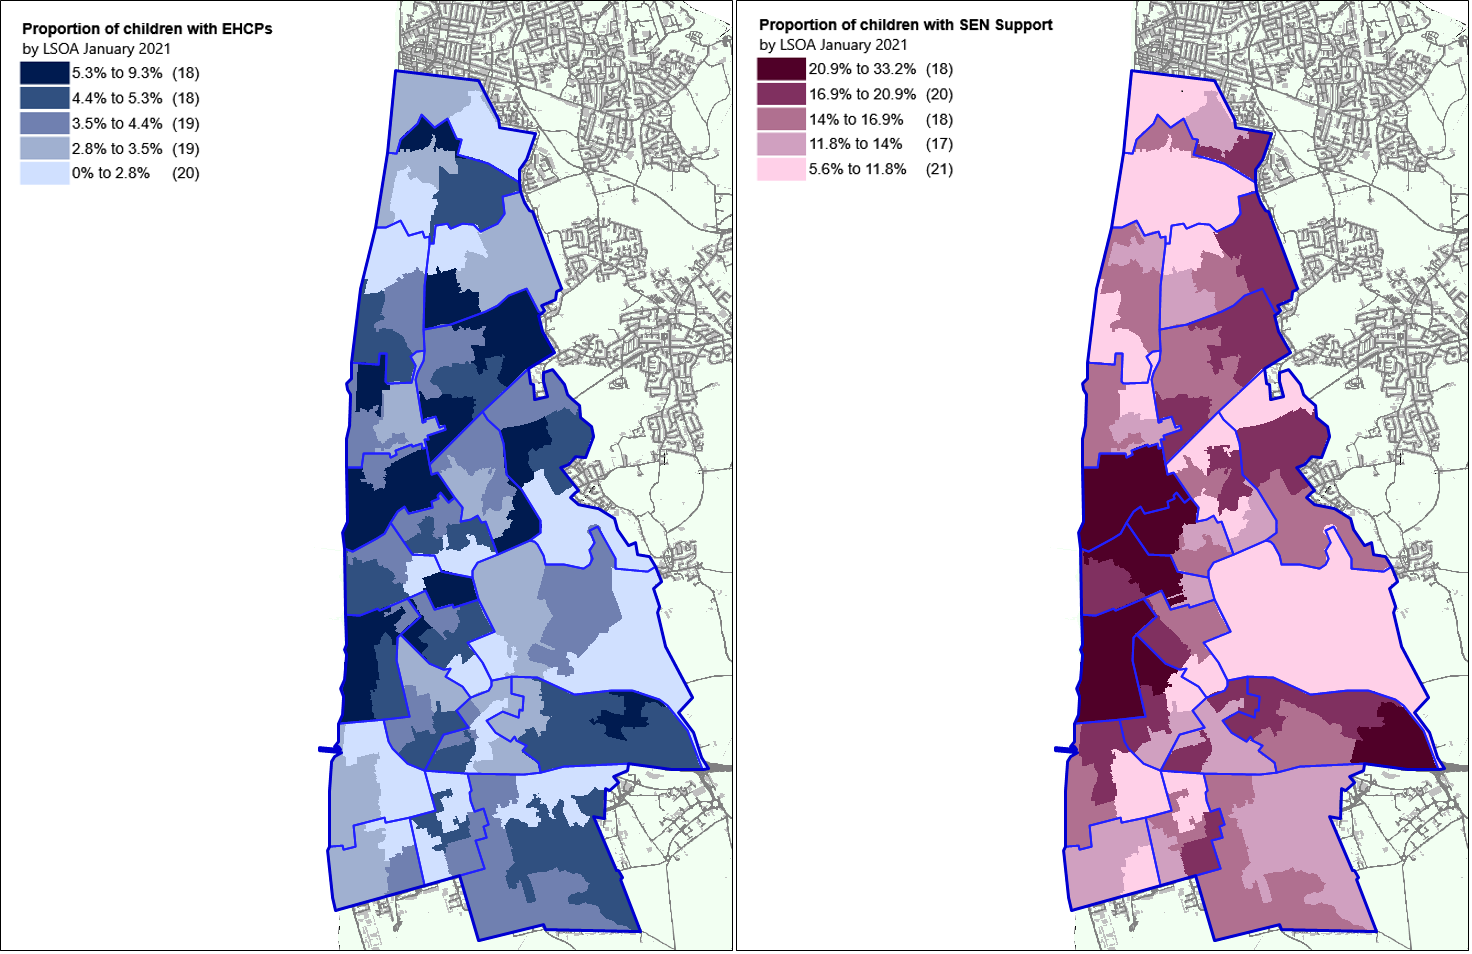 Source: DfE School Census, 2021
Social care provision
Another indicator that can be assessed to ensure we are meeting the needs of our children and young people with SEN is to look at social care provision.
A Looked After Child (LAC) is a child who is housed by the Local Authority instead of their parents. This can often be a temporary arrangement while a family is in crisis, though it can also lead to a permanent rehoming where a child cannot ever be safely returned home. 'Looked After' is a term introduced in the Children's Act 1989 and many legal aspects have also been amended or updated in the Children and Families Act 2015.
A Child in Need (CIN) is defined under the Children Act 1989 as a child who is unlikely to reach or maintain a satisfactory level of health or development, or their health or development will be significantly impaired, without the provision of services, or the child is disabled.
A Child Protection Plan will be put in place by a local authority where there has been investigation into possible abuse or neglect and it is felt that the child or young person is suffering or likely to suffer significant harm. Child protection plans outline what needs to be done to ensure the child or young person is protected and what support will be provided.
Figure 19: Social care provision for children and young people in Blackpool with EHCPs, 2021
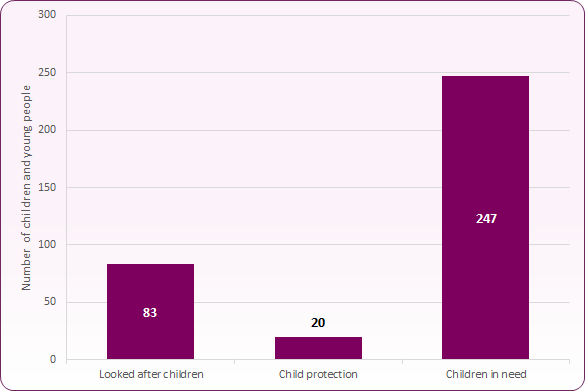 Source: EMS/ONE, Blackpool Council. Data retrieved 07/09/2021
As of the 07/09/2021, there are 83 looked after children, 20 children with a child protection plan and 247 children in need with EHCPs in Blackpool.
The Department for Education also publishes statistics about children in need across England, including those with special educational needs.
Figure 20: Special educational needs in children with social care provision as of 31st March 2020
| Type of social care provision | Special educational needs provision | Blackpool | England |
|---|
| Children in need |
Total number of pupils with SEN support |
150 |
28,810 |
|---|
| Percentage of pupils with SEN support |
24.9% |
21.8% |
| Total number of pupils with EHCP |
151 |
35,300 |
| Percentage of pupils with EHCP |
25.1% |
26.7% |
| Looked after children |
Total number of pupils with SEN support |
116 |
11,390 |
|---|
| Percentage of pupils with SEN support |
33.7% |
28.1% |
| Total number of pupils with EHCP |
72 |
11,220 |
| Percentage of pupils with EHCP |
20.9% |
27.7% |
| Children with child protection plans |
Total number of pupils with SEN support |
83 |
8,720 |
|---|
| Percentage of pupils with SEN support |
35.3% |
29.5% |
| Total number of pupils with EHCP |
19 |
2,630 |
| Percentage of pupils with EHCP |
8.1% |
8.9% |
Source: DfE Outcomes for children in need, including children looked after by local authorities in England, 2020
In summary, as of 31st March 2020, there were 591 children in Blackpool with either SEN support or an EHCP receiving social care provision (either children in need, looked after or on a child protection plan) representing 50% of total children with social care provision. This compares to 48.5% across England.
Of those children receiving social care provision in Blackpool, 29.6% were receiving SEN support compared to 24.2% of those across England.
EHCPs were held by 20.5% of the children receiving social care provision compared to 24.3% across England. Given that EHCPs are held by only 4.3% of Blackpool’s school age population and 3.7% of England’s school age population, this shows a high prevalence of social care provision for children with EHCPs both locally and nationally. There is, however, a lower proportion of looked after children with EHCPs in Blackpool (20.9%) compared to the national average (27.7%), this merits further consideration and investigation.
Interactions with health services
To help understand the health service needs of our SEND population we have assessed data from Blackpool Teaching Hospitals NHS Foundation Trust’s SEND dashboard for children’s services. This gives information about a range of children’s services that may be accessed by children and young people with SEND. This data tells us about all children and young people accessing these services in Blackpool CCG and is not exclusive to those registered as having SEN or a disability.
The services included in the SEND dashboard are Child and Adolescent Mental Health Services (CAMHS), Child and adolescent self-harm enhanced response (CASHER), Children’s Hearing Service, Continence, Neurodevelopmental Pathway, Occupational Therapy, Physiotherapy, Specialist Practitioners in Child Development, Speech & Language Therapy and Youtherapy which is a counselling service for children and young people.
In April 2018 Blackpool Teaching Hospitals launched the Fylde Coast School Age Neurodevelopmental Pathway, an integrated multi-agency pathway for 5-16 year olds who are causing parental and professional concern and who require multi-agency, specialist consideration of their needs. As part of the approach, the child or young person receives assessments from a relevant range of multi-agency team members, such as speech therapy. The team works closely with partners in Education to effectively identify and respond to the individual’s needs.
Figure 21: Total referrals received for SEND dashboard services in Blackpool CCG per month, April 2017- August 2021 (with trendlines for pre-Covid-19 and Covid-19 periods)
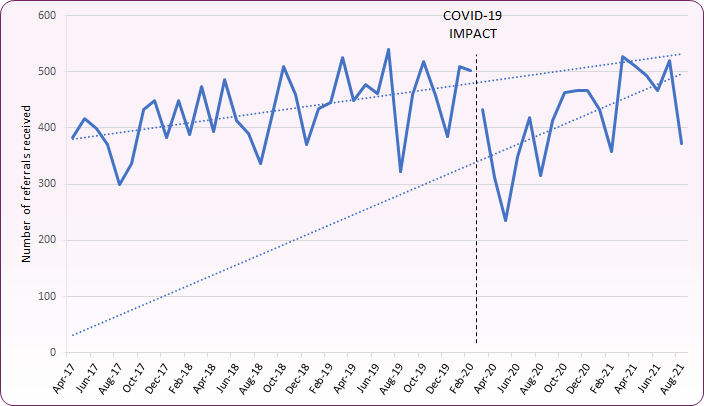 Source: Blackpool Teaching Hospital NHS Foundation Trust SEND Dashboard, accessed 15/09/2021
-
- The average number of referrals per month between April 2017 and August 2021 was 426.
- There was a reduction in referrals to these services after the commencement of the first lockdown in response to COVID-19. Referrals reduced from 433 in March 2020 to 312 in April 2020 before lowering further, the lowest number of referrals being 235 in May 2020.
- During the COVID-19 period the profile of ‘attendances’ at Blackpool Teaching Hospitals SEND health services changed significantly. In 2018/19, 77.9% of the 25,039 attendances / appointments were face-to-face, 21.3% by telephone and 0.8% used multimedia. In 2020/21, there were 29,142 attendances / appointments, with 26.8% face-to-face, 61.4% by telephone, and 11.8% multimedia.
- There is a considerable amount of variation in referrals received across the calendar months, however over this time frame there are a consistently low number of referrals every August during the school summer holidays.
Figure 22: Total referrals per year (April-March) in Blackpool CCG by service
| Service | 2017/18 | 2018/19 | 2019/20 | 2020/21 |
|---|
| Child and Adolescent Mental Health Services (CAMHS) |
1111 |
1222 |
1167 |
1161 |
| Child and Adolescent Self-harm Enhanced Response (CASHER) |
126 |
204 |
231 |
411 |
| Children's Hearing Service |
561 |
539 |
584 |
431 |
| Continence |
370 |
397 |
327 |
340 |
| Neurodevelopmental Pathway |
-- |
117 |
355 |
224 |
| Occupational Therapy |
221 |
231 |
221 |
153 |
| Physiotherapy |
178 |
192 |
204 |
135 |
| Specialist Practitioners in Child Development |
195 |
234 |
205 |
146 |
| Speech & Language Therapy |
947 |
958 |
1091 |
876 |
| Youtherapy |
1072 |
1090 |
1129 |
880 |
| Total |
4781 |
5184 |
5514 |
4757 |
Source: Blackpool Teaching Hospital NHS Foundation Trust SEND Dashboard, accessed 15/09/2021
-
- Overall total referrals per year were rising each year from 2017/18 to 2019/20, however there was a 13.7% reduction in total referrals received for 2020/21 when compared to 2019/20. This is attributed to the COVID-19 pandemic in both the changes to how health services were operating and changes in levels seeking assistance from these services during the height of the pandemic.
- The service consistently receiving the highest number of referrals is CAMHS, closely followed by Youtherapy. In 2020/21 the number of referrals received by CAMHS stayed relatively static, however there was a 22% decrease in referrals to Youtherapy.
- Speech and language therapy also receives a large number of referrals which follows the general trend of gradually increasing demand up until 2019/20 and a reduction in referrals of 19.7% in the COVID-19 pandemic year of 2020/21.
- The Neurodevelopmental pathway is a new service which was introduced in 2018. Initially referrals to this service were quite low however referrals increased by 203% in 2019/20 to 355 before falling to 224 in 2020/21.
Figure 23: Total referrals waiting for Blackpool CCG children’s services related to SEND, by service, April 2020 to October 2021 comparisons
Figure 23: Total referrals waiting for Blackpool CCG children’s services related to SEND, by service, April 2020 to October 2021 comparisons
| Service | Referrals Waiting: Total (over 6 weeks) |
|---|
| Apr 2020 | Oct 2020 | Apr 2021 | Oct 2021 |
|---|
| CAMHS |
38 |
(21) |
83 |
(14) |
189 |
(86) |
184 |
(83) |
| CASHER |
5 |
(1) |
5 |
(2) |
28 |
(7) |
10 |
(2) |
| Children's Hearing Service |
65 |
(16) |
73 |
(43) |
75 |
(36) |
83 |
(34) |
| Continence |
28 |
(13) |
49 |
(4) |
33 |
(0) |
69 |
(14) |
| Neurodevelopmental Pathway |
61 |
(33) |
35 |
(15) |
9 |
(5) |
19 |
(2) |
| Occupational Therapy |
28 |
(17) |
16 |
(7) |
18 |
(7) |
26 |
(15) |
| Physiotherapy |
5 |
(2) |
6 |
(1) |
13 |
(2) |
17 |
(5) |
| Specialist Practitioners in Child Development |
68 |
(56) |
82 |
(63) |
70 |
(46) |
82 |
(56) |
| Speech & Language Therapy |
650 |
(555) |
531 |
(424) |
657 |
(550) |
552 |
(471) |
| Youtherapy |
63 |
(39) |
96 |
(15) |
69 |
(13) |
67 |
(9) |
| Total |
1011 |
(753) |
976 |
(588) |
1161 |
(752) |
1109 |
(691) |
Source: Blackpool Teaching Hospital NHS Foundation Trust SEND Dashboard, accessed 8/12/2021
-
- There has been a slight increase in the overall referrals waiting for these services since April 2020 when the total was 1011.
- The service with the largest increase is CAMHS where referrals waiting increased from 38 in April 2020 to 189 in April 2021 and 184 in October 2021, a 380% increase.
- There has also been an increase in referrals waiting for children’s hearing services. Due to the need for face-to-face provision this service has experienced a greater impact from Covid-19 than some provisions.
- The service with the most referrals waiting is speech and language therapy with 552, 471 of which have waited over 6 weeks. Referrals waiting have been consistently high for this service and the number of referrals waiting in October 2021 is slightly above the previous year.
- There is a relatively small number of referrals waiting for physiotherapy services, however proportionally this has risen by 240% between April 2020 and October 2021.
- The CASHER service (Child & Adolescent Support & Help Enhanced Response Team) shows a 100% increase in referrals waiting, however as a response team the service does not carry a caseload and most of these represent very short waits.
- There has been a 69% reduction in referrals waiting for the Neurodevelopmental Pathway from 61 to 19.
- Youtherapy referrals (up to age 25) waiting for 6 weeks or more have decreased by 77% since April 2020.
During Covid-19 the services implemented an initial contact and telephone review of each child with an EHCP on their caseloads. Part of this review included agreeing EHCP provisions with families within the restricted lockdown period, providing contact details for any issues and agreeing the next contact date. The services have maintained a level of blended approaches to include telephone and virtual contacts in addition to face to face. In accordance with government guidance, and demand, some services stopped (e.g. Hearing), some reduced contacts (e.g. therapies) and others increased due to demand (e.g. EHWB).
Figure 24 shows the breakdown of unique service attendees (face-to-face, telephone and video contacts) in the 12-month period October 2020 to October 2021. The age and gender composition of children and young people accessing SEND health provision varies across services. This is reflective of the nature and type of service and the population served but may also be indicative of wider gender biases in the identification and referral of SEND and mental health issues among children and young people1.
Figure 24: Profile of attendees of Blackpool Teaching Hospitals SEND services, 2020-2021
| Service | Attendees | Male | Female | Average Age |
|---|
| CAMHS |
1078 |
563 (52%) |
515 (48%) |
12.4 |
| CASHER |
352 |
129 (37%) |
223 (63%) |
13.6 |
| Children's Hearing Service |
501 |
307 (61%) |
194 (39%) |
4.7 |
| Continence |
540 |
293 (54%) |
247 (46%) |
7.8 |
| Neurodevelopmental Pathway |
298 |
217 (73%) |
81 (27%) |
10.2 |
| Occupational Therapy |
308 |
181 (59%) |
127 (41%) |
7 |
| Physiotherapy |
311 |
172 (55%) |
139 (45%) |
6.9 |
| Specialist Practitioners in Child Development |
309 |
219 (71%) |
90 (29%) |
2.6 |
| Speech & Language Therapy |
1743 |
1164 (67%) |
579 (33%) |
6.6 |
| Youtherapy |
920 |
316 (34%) |
604 (66%) |
15.2 |
Source: Blackpool Teaching Hospital NHS Foundation Trust SEND data, period 1/10/2020 to 8/10/2021
Educational outcomes
The Department for Education (DfE) provides information relating to the educational attainment and progress of children with EHCPs or in receipt of SEN support.
Phonics and Key Stage 1
At the end of National Curriculum Year 1, 13% of those with an EHCP achieved the expected level in phonics compared to England average of 20% (ranked 117 amongst local authorities). 54% of those receiving SEN Support achieved the expected level compared to 48% nationally (ranked 32 amongst local authorities).
Key Stage 1 data for 2019 shows that, in Blackpool, the percentage of children with EHCPs meeting the expected level of reading, writing and mathematics at Key Stage 1 was around half the national average for all three domains (figure 25). For those in receipt of SEN Support, reading and writing levels were similar to the national average, though mathematics was lower.
Source: DfE, Phonics screening check and Key Stage 1 assessments, 2019)
Key Stage 2
The Local Authority Interactive Tool compiles a range of data relating to children and young people, enabling the benchmarking of authorities against national, regional and statistical neighbours.
-
- In 2019, 15% of children with EHCPs achieved the expected level at Key Stage 2 (KS2), an increase from 8% in 2018. This is compared to the England average of 9%, with Blackpool ranked 15th nationally. For those SEN supported children without EHCPs, 35% achieved the KS2 expected level in 2019, an increase from 15% in 2016. This is compared to the England average of 25%.
- KS2 subject level data (figure 26) shows that, in 2019, children with EHCPs and SEN support progressed at or above the England average, with the exception of writing for those with SEN support, which was slightly below the England average.
Source: Local Authority Interactive Tool (LAIT), July 2021
Note: Educational attainment measures are currently under revision and the system of national curriculum levels is no longer used to report end of key stage assessment. Additionally, from the 2021/22 academic year the UK Government Engagement Model will be used to assess pupils working below national curriculum assessment levels and not engaged in subject-specific study at Key Stage 1 and Key Stage 2.
Key Stage 4 and Post-16 Education, Employment and Training
The ‘Attainment 8’ score measures the average achievement of pupils in up to eight qualifications at the end of Key Stage 4, whilst the ‘Progress 8’ score captures the progress of pupils between KS2 and KS4 (figure 27). 2019 and 2020 data shows that both attainment and progress fall significantly below national averages by Key Stage 4 for those with EHCPs and SEN Support, with Blackpool in the bottom quartile of all local authorities. This is also reflected in the scores for those with no identified SEN. Average Progress 8 scores for those with SEN support have fallen from -0.44 in 2016 to the current level of -0.101.
Source: Local Authority Interactive Tool (LAIT), July 2021
In terms of post 16 education, employment and training, in 2019:
-
- 100% of SEN pupils with EHCPs at the end of KS4 went to, or remained in education, employment or training. This figure has been at or above the England average (currently 90%) for the last six years.
- 87% of pupils in receipt of SEN Support at the end of KS4 went to, or remained in education, employment or training, below the England average of 89%.
- 71.4% of 16-17 year olds with SEN were in Education and Training as at 31 December 2019, compared to the England average of 88.47%. This is around 10% lower than the previous year.
Figure 28 shows the percentage of 19 year olds achieving Level 2 English and Maths and Level 3 qualifications (2 or more A-levels or equivalent) by SEN status. For those with EHCPs, the proportion of young people for both Level 2 and Level 3 qualifications are below the England average, whilst the outcomes of those with SEN support are slightly above national average.
Source: Local Authority Interactive Tool (LAIT), July 2021
School attendance
Overall school absence rates for local authorities are based on the total absences and possible sessions for all enrolled students within the relevant area. Trend data provided below covers the period up to 2018/19 academic year. Due to the impact of COVID-19, the 2019/20 DfE data release was cancelled, however absence data for the Autumn 2020/21 term (coinciding with school re-opening on 1 September 2020) is available and is referred to separately since it is still impacted by pupils self-isolating, quarantining and, in some cases, shielding.
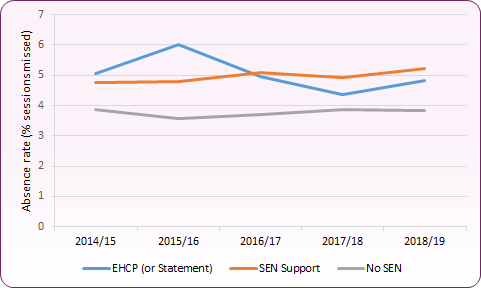
Primary school absence rates between 2014/15 and 2018/19 remained relatively stable in Blackpool (figure 29), though there was a reduction in rates for children with EHCPs from 6% in 2015/16 to 4.4% in 2017/18. The 2018/19 absence rate for those with EHCPs was 4.8%, the 4th lowest rate in the country (England average = 7%). The 2018/19 rate for those with SEN support was 5.2%, slightly below the England average of 5.4%. For those with no SEN, the Blackpool rate of 3.8% was similar to the national average (3.7%).
For the autumn term 2020/21, EHCP absence rate in Blackpool primary schools increased to 5.8% (the 20th lowest rate among local authorities), with the SEN Support absence rate falling slightly to 4.9% (ranked 59th).
Figure 29: Primary School Absence Rates in Blackpool, 2014/15 to 2018/19
 Source: DfE, Pupil Absence in Schools, 2018 to 2019
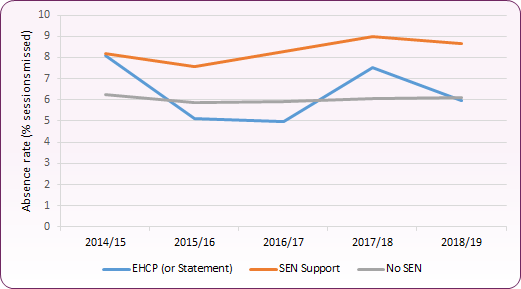
Secondary school absence rates for those with EHCPs have fluctuated year-on-year, and in 2018/19 the rate of 6% was significantly below the national average (8.6%), the 7th lowest rate in the country. Absence rates for SEN Support rose from 7.6% in 2015/16 to 9% in 2017/18, and in 2018/19 the rate of 8.7% was higher than the national average of 8.1% (Blackpool ranked 113th in the country). Blackpool’s 2018/19 rate of 6.1% for those with no SEN was the 9th highest in the country (England rate = 5.1%).
For the autumn term 2020/21, EHCP absence rates in Blackpool secondary schools increased to 10% (ranked 86th amongst local authorities), with SEN Support absence rates at 8.3% (ranked 78th).
Figure 30: Secondary School Absence Rates in Blackpool, 2014/15 to 2018/19
 Source: DfE, Pupil Absence in Schools, 2018 to 2019
Special school absence rates for those with EHCPs have remained between 5.8% and 6% since 2014/15. The 2018/19 rate was 5.8% compared to the national average of 9.9%, the second lowest in England. The absence rate for the Autumn 2020/21 term was also 5.8% (5th lowest in England).
School exclusions
The Department for Education publishes annual school exclusion data using measures based on two types of exclusion – ‘permanent’ (excluded and will not be allowed to return to the school) and ‘fixed period exclusion’ (exclusion for one or more fixed periods up to a maximum of 45 days in the school year). Calculations are based on the total number of exclusions (numerator) divided by the number of registered pupils (denominator), multiplied by 100 to generate a percentage. Since pupils can have more than one fixed period exclusion this figure can exceed 100%, so it is important to note that the value does not represent the proportion of students excluded.
Please note: Data provided in this section refers to the 2019/20 period, which was affected by the first national lockdown due to COVID-19. Figures from this period will reflect this.
In primary school settings, permanent exclusions for both Blackpool and the rest of the country are rare. Between 2017/18 and 2019/20 there were no permanent exclusions recorded in Blackpool for either children with SEN or for those with no SEN.
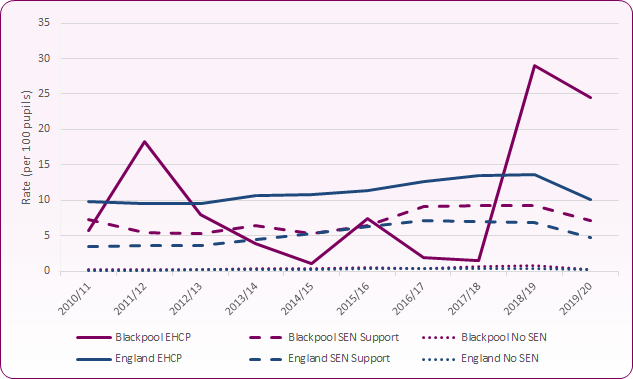
The rate of fixed period exclusions for those with EHCPs within primary schools in 2019/20 was 24.4 per 100 pupils, the 4th highest rate in the country (compared to the England average of 10). This rate has risen from 1.5 in 2017/18 (figure 31). The rate of fixed period exclusions for those in receipt of SEN Support rose gradually from 2012/13 to 2018/19. In 2019/20 the fixed period exclusion rate was 7.2 per 100 pupils, compared to 4.8 nationally.
Figure 31: Primary school fixed period exclusion rates, Blackpool and England, 2010/11 to 2019/20
 Source: DfE, Permanent Exclusions and Suspensions in England, 2019 to 2020
Along with 97 other local authorities, Blackpool recorded no permanent exclusions at secondary schools for those with EHCPs in 2019/20. The permanent exclusion rate for those with SEN Support between 2016/17 and 2018/19 averaged 1.4 per 100 pupils per academic year, falling to 0.49 in COVID-19 affected 2019/20. The England average rate over the same period was 0.7 per 100 pupils, falling to 0.4 in 2019/20.
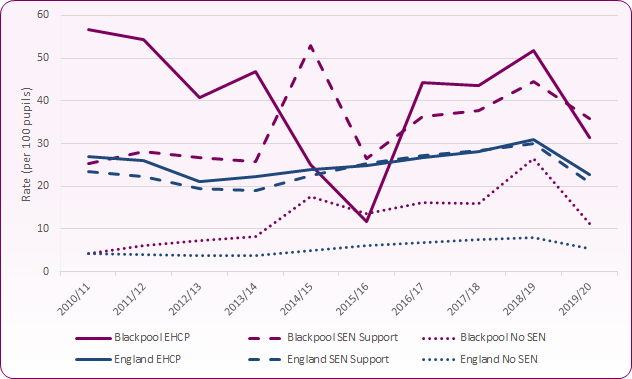
The rate of fixed period exclusions for those with EHCPs in Blackpool secondary schools in 2018/19 was 51.9 (9th highest rate in England), compared to the England average of 30.9 (figure 32). In 2019/20 the rate was 31.4 per 100 pupils compared to 22.7 nationally. Rates of fixed period exclusions for those with SEN Support are also higher than the England average. In 2018/19 the Blackpool rate was 44.6 per 100 pupils, compared to 29.9 nationally. In 2019/20 the rate dropped to 35.9 compared to 20.8 nationally, with Blackpool ranked in the bottom quartile of local authorities. It is also worth noting that the fixed period exclusion rate for those without SEN in Blackpool is significantly higher than the national average (the 6th highest in England in 2018/19).
Figure 32: Secondary school fixed period exclusion rates, Blackpool and England, 2010/11 to 2019/20
 Source: DfE, Permanent Exclusions and Suspensions in England, 2019 to 2020
Blackpool special schools have recorded no permanent exclusions for pupils with EHCPs (or previously Statements) over the last 10 years. The rate of fixed period exclusions for those with EHCPs in this setting has also remained significantly lower than the England average. In 2018/19 the Blackpool rate was 1.67 per 100 pupils with EHCPs (ranked 17th of 151 local authorities), compared to the England average of 11. The rate did, however, rise to 1.98 in COVID-19 affected 2019/20, whilst the national average fell to 7.6.
Feedback from children, young people, parents and carers
Blackpool Council and Blackpool Teaching Hospitals NHS Foundation Trust work in partnership to support engagement, participation and consultation activities for children and young people with SEND and their parents / carers. This includes facilitating and supporting the Young Empowerment Forum, The A Team Group (for children with Autistic Spectrum Condition), Parent / Carer Forum and newly established Junior Young Empowerment Forum, as well as specific consultations around areas such as the SEND strategy, Local Offer, Schools, Play Inclusion, medical feedback consultations, and Covid-19 impact.Through these processes children and young people have identified a range of needs and issues to inform SEND policy and practice in Blackpool, including:
-
- Ensuring accessible spaces, SEND provision, and inclusive activities for young people and families are available to all across the SEND age range
- Opportunities for information, support and activities on independence, life skills and preparation for adulthood (employment, education, training etc.)
- Ensuring opportunities for support and social contact to address issues of isolation, bullying, friendship-building and social contact (exacerbated for some by Covid-19)
- Access to public transport: using buses and timetables, safety, and asking for help
- Improve accessibility of Local Offer website, and its representation of people with SEND in artwork
- Improve accessibility of local authority policies and strategies
- Having an increased say in how children and young people with SEND would like to be supported and involved
- Improve professional training on how to care for young people with learning disabilities and autism
- Knowing more about the impact of consultation and children / young people’s voice.
Parents' and carers' engagement has also identified needs including:
-
- Increasing awareness of Local Offer website
- Improving information about EHCPs, mental health provision and other aspects of SEND provision (via Local Offer)
- Increasing involvement / participation of children in Young Empowerment Forum, Junior Young Empowerment Forum and other participation activities
- Increasing opportunities for feedback on areas such as EHCPs, health and social care provision, inclusive activities and preparation for adulthood.
Blackpool Council and Blackpool Teaching Hospitals have responded to feedback in a number of ways, including:
-
- Incorporation of children, young people and parent feedback into SEND strategy
- Development of ‘Easy Read’ policies, reports, minutes, and ‘You Said, We Did’ feedback for children / young people with SEND
- Revisions to Local Offer website to provide improved search / filtering and jargon-busting information
- Establishment of Junior Young Empowerment Forum for primary age children
- Participatory project with Young Empowerment Forum to develop videos to provide information for young people with SEND on using public transport and staying safe. This is supported by Blackpool Transport outreach service who offer additional support and confidence building.
- Young Empowerment Forum development of ‘Top Tips to Engage Us’ – advice for practitioners working with young people with SEND about involvement and engagement approaches
- Young People supported the development of leaflets for health preparing for adulthood (transitions0 which included an easy read and pictorial version for young people.
The data shows a significant unmet need around speech, language and communication compared with a similar Local Authority and that primary schools have the highest level of need – reading and writing data at Key Stage 1 compared to Key Stage 2 information demonstrates a noteworthy improvement suggesting children are starting school already disadvantaged. Health information further indicates a 16% increase in referrals to the speech & language service from 2017/18, except during 2020 potentially due to the Covid impact and many school closures.
Recommendation 1: The Local Area must review the speech & language provision across all services in order to meet need and reduce inequalities.
Exclusion data demonstrates from 2018 there has been a significant increase in fixed term primary school exclusions for children and young people with EHCP’s with secondary exclusions high for both EHCP and SEN levels of need. On reviewing placements for children and young people with EHCP’s, Blackpool has a higher than average number within special schools and lower than average number in mainstream schools - both indicating a greater need for support within Blackpool mainstream schools.
Recommendation 2: The Local Area must conduct a review of exclusions within schools and identify the support required to pupils, staff and environments to de-escalate pupils’ responses to situations and keep them in schools, ultimately reducing inequalities.
Children and young people together with parents and carers have told us that they want better communication and ways to get involved in order to provide feedback.
Recommendation 3: The Local Area must develop an engagement strategy and work towards co-production in every aspect of its work.
[] Dockrell, J., Peacey, N. & Lunt, I. (2002) Literature Review: Meeting the needs of children with special educational needs. Institute of Education, University of London [accessed 18/10/2021].
Black, A. (2019) A Picture of Special Educational Needs in England – An Overview. Frontiers in Education, 4:79. doi 10.3389/feduc.2019.00079 [accessed 18/10/2021].