School Life
Last Modified 29/03/2023 09:22:44
Share this page
Introduction
At the January 2022 school census date there were 33 Primary Schools, eight Secondary Schools (two 'all-through schools' are included in both the primary and secondary numbers given), and four Special Schools in Blackpool. Blackpool and the Fylde College, Blackpool Sixth Form College, and St. Mary's Catholic Academy Sixth Form are the post-16 education providers within the authority.
At the census point, 16 primary schools, all secondary schools, and one all-through school were academies. A further primary school and the second all-through school were free schools. Two further primary schools have since converted to academies, with 12 primary schools now maintained by the Local Authority. Among the four state-funded special schools, one was an academy, one a free school, and two were community special schools.
Figures from the January 2022 School Census show a school population of 19,811 pupils, 11,619 of whom are on roll within a primary school, 5,511 attend a secondary school and 1,949 attend a through school in Blackpool. There are 585 pupils attending Special Schools.
The majority of Blackpool's primary schools are judged by Ofsted to be good, with two outstanding. Three secondary schools have been judged as good, though four are identified as requiring improvement. This is, however, an overall improvement from 2017 when only one secondary school received an Ofsted assessment of 'good'.
Data shows the proportion of primary pupils reaching the expected standard at key stage 2 in Blackpool is around that of the national average, however, secondary school attainment falls behind the national average significantly and the rate of progress made by pupils is one of the lowest in the country.1
Definitions of School Types
Academy schools are state-funded schools in England which are directly funded by the Department for Education and independent of local authority control.
Free schools are set up by an organisation or a group of individuals, funded by the government but not controlled by the local authority.
Local Authority maintained schools are overseen, or 'maintained', by the Local Authority.
Special Schools cater for children with special needs.
For further information please see the New Schools Network brief.
Facts and Figures
Covid Impact - Note
The COVID-19 pandemic had a major impact on both schools and school data, particularly in the academic years 2019/20 and 2020/21, with school closures, absences and cancelled or adjusted assessments. As a consequence, many education statistics releases for this period were either cancelled, or are not comparable to previous years.
Deprivation Factors in Blackpool
Blackpool is an area of high deprivation with significant proportions of children coming from backgrounds that suffer from one or more types of deprivation. In Figure 1 the Index of Multiple Deprivation 2019 (IMD 2019) has been used to estimate the level of disadvantage of the Blackpool school population.
Figure 1 - Proportion of Children who live in the 10% most deprived neighbourhoods attending Blackpool primary and secondary schools
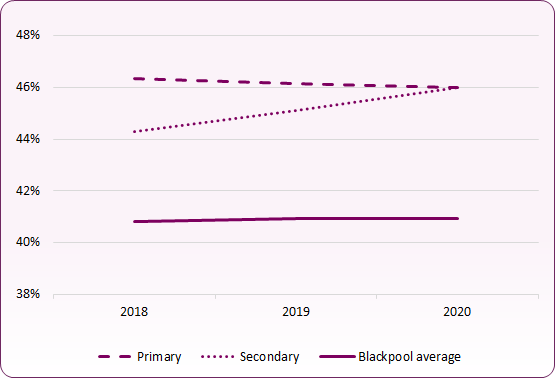 Source: Mid-year populations estimated 2018-2020 (age 4-10s and 11-15s) and IMD 2019 Based on 2020 population estimates, 46% of both primary and secondary school pupils live in the 10% most deprived neighbourhoods in England, compared to 41% of the overall Blackpool population. The proportion of secondary pupils living in the most deprived areas has increased due to estimated population growth, whilst primary school deprivation proportions have fallen slightly. Levels of deprivation are higher than previous calculations made using 2015 IMD data due to the inclusion of a further three Blackpool areas (LSOAs) within the 10% most deprived group.
The Pupil Premium
The Pupil Premium is additional funding available for publicly funded schools in England to raise the attainment of disadvantaged pupils and close the gap between them and their peers.
Pupil premium funding is available to:
-
- local authority maintained schools, including special schools and pupil referral units (PRUs)
- voluntary-sector alternative provision (AP), with local authority agreement
- special schools not maintained by the local authority (NMSS)
- academies and free schools, including special and AP academies
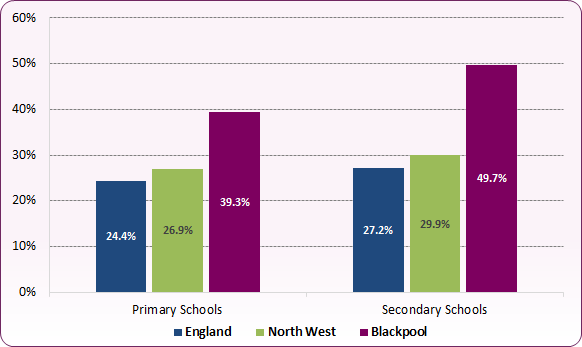
The Pupil Premium funding for Blackpool schools in 2022/23 was significantly above the national average (Figure 2).
Figure 2: Percentage of pupils eligible for Pupil Premium in 2022/23
 Source: Education and Skills Funding Agency, Pupil premium: allocations and conditions of grant 2022 to 2023
Blackpool ranks as having the 9th highest proportion of pupil premium eligible pupils in primary education in England and the 4th highest for secondary education in England (out of 152 local authorities). Within the North West region (23 local authorities), Blackpool has the second highest percentage of eligible pupils in both primary and secondary education cohorts.
Characteristics that Influence School Life
Looked after children - Blackpool has the highest rate of looked after children in England with a rate of 210 children per 10,0002 (as of 31st March 2021). Children who have been looked after by local authorities tend to be disproportionately represented in groups of people experiencing problems in life.
Exclusions - Children who are excluded from schools will be at a disadvantage and in Blackpool in 2019/20 there were 199 (1.7%) fixed period exclusions from primary schools and 1,099 (15.6%) fixed period exclusions from secondary schools. In Covid-19 affected 2020/21 there were 123 fixed period exclusions from primary schools (1.1%) and 1,120 fixed period exclusions from secondaries (15.5%).3
A range of other factors appear to affect the achievement of children in Blackpool schools. Children who are born in the summer tend to be at a disadvantage, those with special educational needs may be less successful (depending on their needs) and pupils who do not attend school regularly tend not to do as well as those who do.
School Achievement: Primary School
Primary school achievement is measured at several points during a child's primary education:
School Readiness
Children at the end of the Early Years Foundation Stage (EYFS) (usually the end of reception year) are defined as having reached a good level of development if they achieve at least the expected level in the teacher assessed early learning goals in the prime areas of learning (personal, social and emotional development; physical development; and communication and language) and the early learning goals in the specific areas of maths and literacy. This ‘school readiness’ indicator is a key measure of early years development but, due to the Covid-19 pandemic, was not reported in 2019/20 and 2020/21. 2021/22 statistics are the first since EYFS reforms were introduced in September 2021 which significantly revised the EYFS profile. Assessment outcomes cannot, therefore, be directly compared to previous years.
In 2021/22:
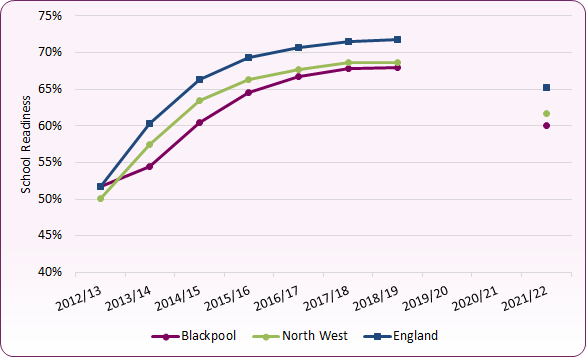
- 60.1% of children reached a good level of development, compared to 65.2% nationally and 61.7% across the North West. This is the 11th lowest local level among 152 local authorities across the country.
- 68% of girls reached a good level of development (71.9% nationally) compared to 52.7% of boys (58.7% nationally)
- 48.9% of those known to be eligible for free school meals reached a good level of development (49.1% nationally), compared to 64.9% of those not known to be eligible (68.8% nationally). 29.7% (491) of the Blackpool cohort were known to be eligible for free school meals, compared to 18.3% nationally.
- 69.6% of autumn-born children reached a good level (73.8% nationally), 59.4% of spring-born (65.8% nationally) and 50.8% of summer born children (55.7% nationally).
- 57.4% reached the expected level across all early learning goals, compared to 63.4% nationally and 59.7% across the North West. 61.3% of children reached the expected level of communication and language and literacy areas of learning, compared to 67.1% nationally and 63.6% across the North West.
Figure 3: Proportion of children achieving a good level of development at the end of reception - Blackpool, North West and England, 2012/13 to 2020/21
 Source: PHE, Child and Maternal Health Profile, School age children
The revised Early Years Foundation Stage Profile is broken down into seven specific areas of learning:
- Communication and Language
- Physical Development
- Personal Social and Emotional Development
- Literacy
- Mathematics
- Understanding the World
- Expressive Arts and Design
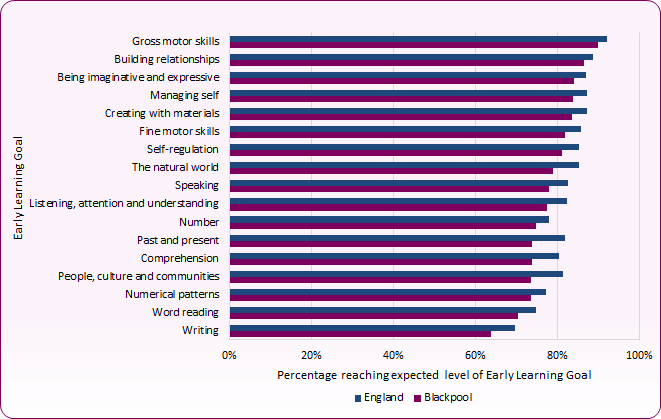
Within each of these areas there are specific Early Learning Goals. Children are graded under each goal as to whether they are reaching the expected level for their age or are ‘emerging’, or not quite reaching the goal at present. According to 2021/22 assessments, the proportion of children in Blackpool reaching the expected level of Early Learning Goals is between 2 and 6 percentage points lower than the national average (Figure 4). The greatest differences are observed in ‘people, culture and communities’ (73% compared to 81% nationally), ‘past and present’ (74% compared to 82% nationally), and ‘comprehension’ (74% compared to 80% nationally). Writing had the lowest proportion of children reaching the expected level both locally and nationally, with 64% of Blackpool children reaching the expected level compared to 70% in England.
Figure 4: Proportion of children reaching the expected level of Early Learning Goals, Blackpool and England, 2021/22
 Source: Department for Education, Early years foundation stage profile (EYFSP) results: 2021 to 2022
Phonics Check
Phonics is a way of teaching children to read quickly and skilfully. They are taught how to:
-
- recognise the sounds that each individual letter makes;
- identify the sounds that different combinations of letters make - such as 'sh' or 'oo'; and
- blend these sounds together from left to right to make a word.
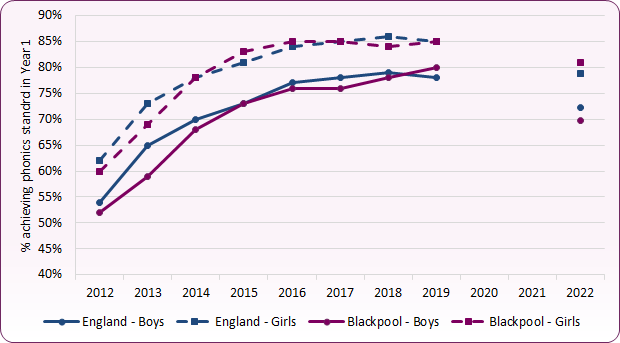
Children can then use this knowledge to 'de-code' new words that they hear or see. This is the first important step in learning to read. A check on the progress children are making in phonics is carried out in year 1 (age 6), and repeated the following year for those who did not meet the standard or were not previously checked. While progress has been made in both Blackpool and England since 2012, there is still a wide gap in achievement between boys and girls (Figure 5).
Figure 5: Percentage of children achieving the required standard of phonics decoding, 2012 - 2022
 Source: Department for Education, Key Stage 1 and phonics screening attainment, 2021/22
Key Stage 1 Teacher Assessments
Key Stage 1 (KS1) covers the ages five to seven (Years 1 and 2 of Primary education) and the end of KS1 assessments cover progress made by children. In September 2014 the primary school curriculum changed with the main aim of raising standards and although the new curriculum is intended to be more challenging, the content is actually slimmer than the previous curriculum, focusing on essential core subject knowledge and skills such as essay writing and computer programming.
Pupils were assessed against the new curriculum for the first time in 2016 and results are no longer reported as levels, but as 'reaching expected standard' and 'working at a greater depth'. Because of these assessment changes, figures for 2016 onwards are not comparable to earlier years. Assessments are carried out in: Reading, Writing, Maths and Science (there is no 'greater depth' assessment for Science).
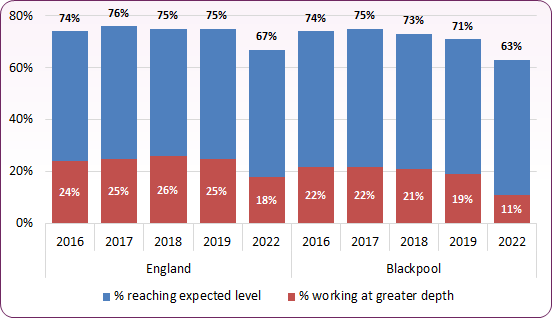
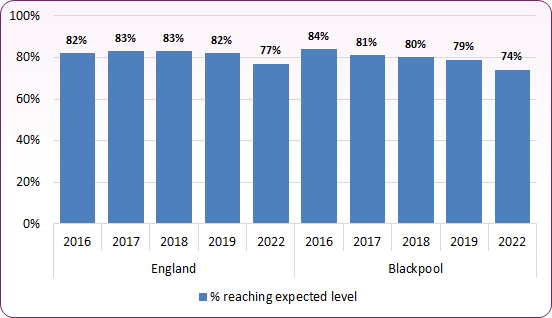
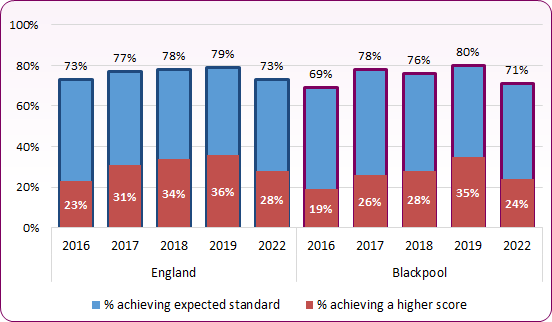
As Figures 6 to 9 show, the proportion of Blackpool pupils reaching the expected standard across subject areas has tended to be slightly lower than national levels, though 2018 and 2019 saw gaps widening due to reducing proportions of children in Blackpool achieving the standards. Assessments were not carried out in 2020 and 2021 due to Covid-19, but 2022 results show national and local declines in children reaching the expected standard, as well as a widening of the achievement gap between Blackpool and England in writing and mathematics.
Figure 6: Percentage of children achieving the expected standard and reaching the higher standard in Key Stage 1 READING assessments, 2016 to 2022
 Source: Department for Education, Key Stage 1 and phonics screening attainment: England 2016 to 2022 data. Note break in data between 2019 and 2022 (due to Covid-19).
Figure 7: Percentage of children achieving the expected standard and reaching the higher standard in Key Stage 1 WRITING assessments, 2016 to 2022
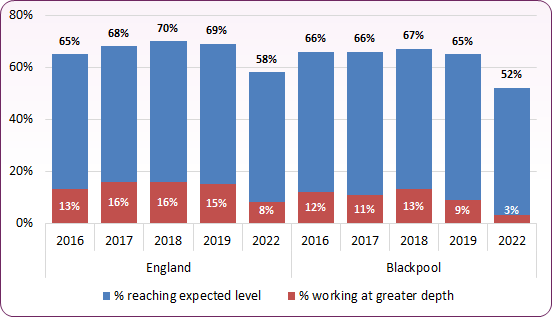 Source: Department for Education, Key Stage 1 and phonics screening attainment: England 2016 to 2022 data. Note break in data between 2019 and 2022 (due to Covid-19).
Figure 8: Percentage of children achieving the expected standard and reaching the higher standard in Key Stage 1 MATHEMATICS assessments, 2016 to 2022
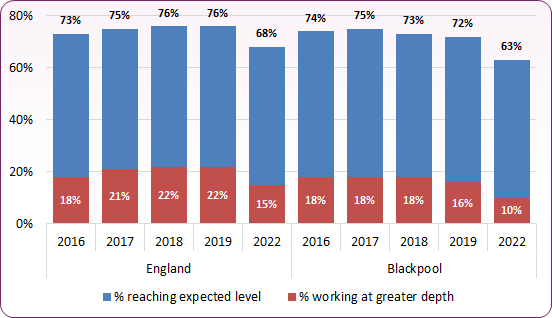 Source: Department for Education, Key Stage 1 and phonics screening attainment: England 2016 to 2022 data. Note break in data between 2019 and 2022 (due to Covid-19).
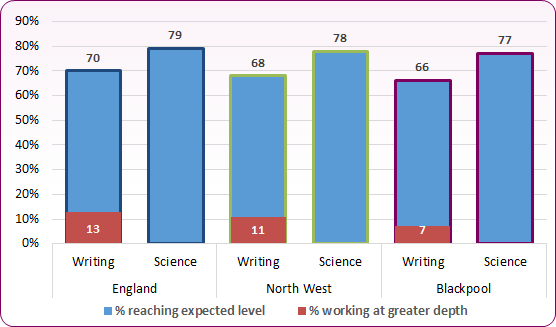
Figure 9: Percentage of children achieving the expected standard in Key Stage 1 SCIENCE assessments, 2016 to 2022
 Source: DfE, Phonics screening check and key stage 1 assessments: England 2016 to 2022 data. Note break in data between 2019 and 2022 (due to Covid-19).
Key Stage 1 Achievement by Characteristic
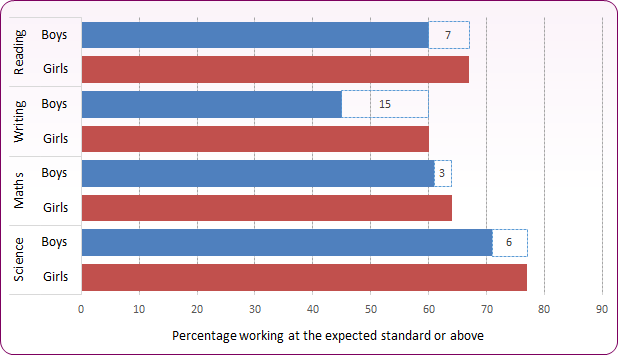
At KS1 more girls reach the expected standard than boys in all subjects (Figure 10). Across Blackpool, the subject with the largest difference in attainment by gender is writing, with a gap of 15 percentage points between girls (60%) and boys (45%). The attainment gap is 7 percentage points in reading, with 67% of girls and 60% of boys reaching the standard; 3 percentage points for maths, with 64% of girls and 61% of boys reaching the standard; and 6 percentage points for science, with 77% of girls and 71% of boys reaching the standard.
Gender gaps in reading, writing and science widened between pre-Covid 2019 and the next reported assessment in 2022, though reductions in achievement levels are observed in both boys and girls in all domains over this period. The proportion of boys achieving the expected standard in KS1 writing dropped from 58% to 45%, and for girls the proportion fell from 72% to 60%. In reading, the proportion of boys achieving the expected standard fell from 71% to 60%, whilst for girls the proportion fell from 75% to 67%.
Figure 10: Attainment gaps by gender in pupils reaching the expected standard in KS1 teacher assessments, Blackpool, 2022
 Source: Department for Education, Key Stage 1 and phonics screening attainment, 2021/22
Measuring whether different groups of children achieve the expected amount of progress at KS1 reveals that various kinds of disadvantage negatively affect progress at KS1. The effects are not as strong as those seen later in a child's school career at GCSE (KS4) stage, though the assessments are different in nature.
Note: Proportions for pupils from Black and 'other ethnic groups' in Blackpool are not included due to low eligibility numbers.
Figure 11: Percentage of pupils reaching the expected standard in KS1 READING assessments by characteristic of child, Blackpool, 2022
 Source: Department for Education, Key Stage 1 and phonics screening attainment, 2021/22
Figure 12: Percentage of pupils reaching the expected standard in KS1 WRITING assessments by characteristic of child, Blackpool, 2022
 Source: Department for Education, Key Stage 1 and phonics screening attainment, 2021/22
Figure 13: Percentage of pupils reaching the expected standard in KS1 MATHS assessments by characteristic of child, Blackpool, 2022
 Source: Department for Education, Key Stage 1 and phonics screening attainment, 2021/22
Figure 14: Percentage of pupils reaching the expected standard in KS1 SCIENCE assessments by characteristic of child, Blackpool, 2022
 Source: Department for Education, Key Stage 1 and phonics screening attainment, 2021/22
Key Stage 2 Testing and Teacher Assessments
Children are again assessed at age 11 in year 6 of Primary School. The 2016 Key Stage 2 (KS2) tests and assessments were the first to assess the new, more challenging national curriculum which was introduced in 2014. Pupils are assessed by national curriculum tests in reading, maths and grammar, punctuation and spelling. They also receive a teacher assessment outcome in writing, science, reading and maths based on the standards in the teacher assessment frameworks at the end of key stage 2.
DfE data for 2019 showed that, overall, 67% of children in Blackpool attained the expected standard in all of reading, writing and maths, above the national average of 65%. At the next post-Covid assessment point in 2022 the proportion of pupils attaining the expected standard in Blackpool had fallen to 56%, compared to 59% nationally.
At individual subject level, the proportion of children reaching the expected standard in Blackpool at KS2 improved between 2016 and 2019 in the reading; maths; and grammar, punctuation and spelling (GPS) tests, and prior to Covid-19 were similar to or exceeded national averages. However, 2022 results showed proportions in Blackpool once again lower than national levels across all subject areas (Figures 15 to 18).
Figure 15: Percentage of children achieving the expected standard and higher scores in KS2 READING Tests, 2016 to 2022
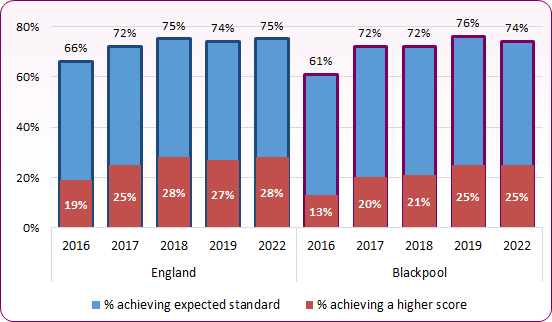 Source: DfE, National curriculum assessments at key stage 2, England 2016 to 2022 data
Figure 16: Percentage of children achieving the expected standard and higher scores in KS2 MATHEMATICS Tests, 2016 to 2022
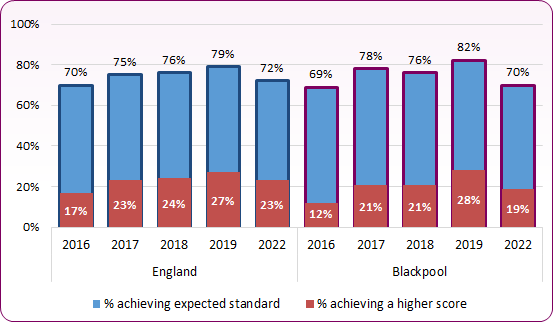 Source: DfE, National curriculum assessments at key stage 2, England 2016 to 2022 data
Figure 17: Percentage of children achieving the expected standard and higher scores in KS2 GRAMMAR, PUNCTUATION AND SPELLING Tests, 2016 to 2022
 Source: DfE, National curriculum assessments at key stage 2, England 2016 to 2022 data
Figure 18: Percentage of children achieving the expected standard (and working at a greater depth in writing) in KS2 Teacher Assessments, 2022
 Source: DfE, National curriculum assessments at key stage 2, England 2021/22.
Key Stage 2 Achievement by Characteristic
As in previous years, girls on average do better than boys in reading, writing and maths combined. In 2019, 72% of girls in Blackpool achieved the expected standard in all of reading, writing and maths compared to 61% of boys. This is a gap of 11 percentage points, more than in 2017 when there was a 6 percentage point difference. Nationally, the gap in 2019 was 9 percentage points (70% for girls, 61% for boys).
A higher proportion of girls also reached the higher standard of reading, writing and maths in 2019, with 9% of girls and 6% of boys achieving this level, a difference of 3 percentage points.
The gender gap continues in 2022 assessments, but with reduced proportions for both boys and girls: 60% of girls and 50% of boys achieved the expected standard in reading, writing and maths (a gap of 10 percentage points). Nationally the gap was 8 percentage points (63% for girls and 55% for boys).
The proportion of those reaching the higher level standard also decreased in 2022, with 5% of girls and 3% of boys achieving this level, a difference of 2 percentage points.
At individual subject level, a higher proportion of girls than boys reach the expected standard in all subjects, as shown in Figure 19. The biggest attainment gap between boys and girls is in teacher assessment for writing at 15 percentage points.
Figure 19: Attainment gaps by gender in pupils reaching the expected standard in KS2 tests and teacher assessments, Blackpool, 2022
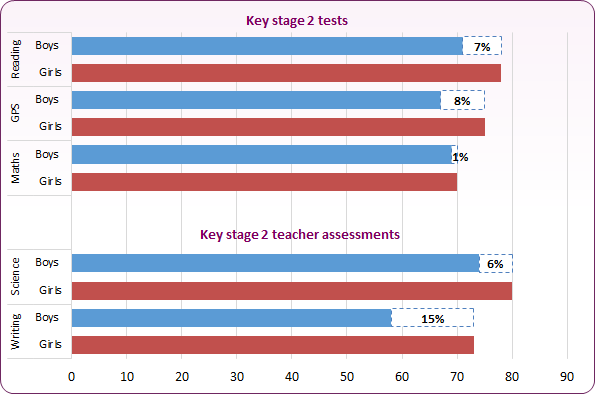 Source: DfE, National curriculum assessments at key stage 2, England 2021/22
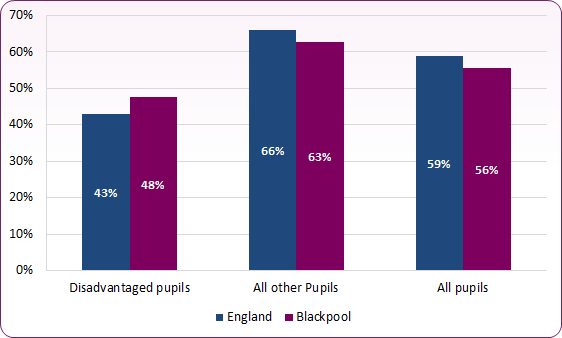
Achievement of the expected standard is affected negatively by deprivation and disadvantage issues. Disadvantaged pupils are defined as those who are registered as eligible for free school meals, children looked after by the local authority, and children who left care. In 2022, 47% of pupils at the end of KS2 were classed as disadvantaged in Blackpool.
Figure 20 shows the proportion of disadvantaged pupils reaching the expected standard in all of reading, writing and maths. While more disadvantaged pupils in Blackpool achieved the expected standard than across England, there is a 15 percentage point difference between them and all other pupils in Blackpool. Figure 21 shows the percentage of pupils reaching the expected standard in all of reading, writing and maths by specific characteristic of child.
Figure 20: Percentage of pupils reaching the expected standard in reading, writing and maths at the end of KS2 (by disadvantage status), 2022
 Source: DfE, National curriculum assessments at key stage 2, England 2021/22
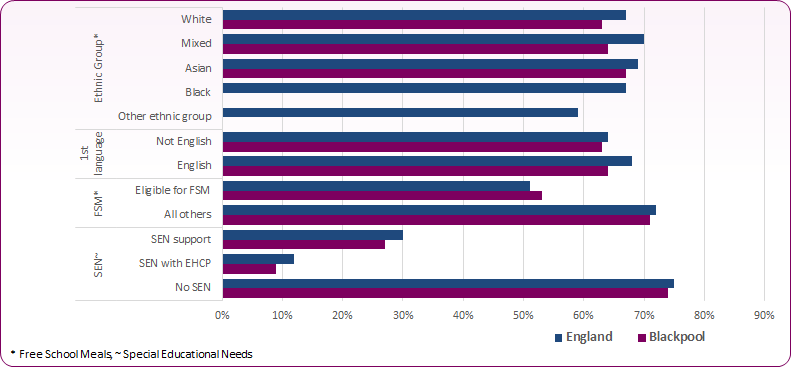
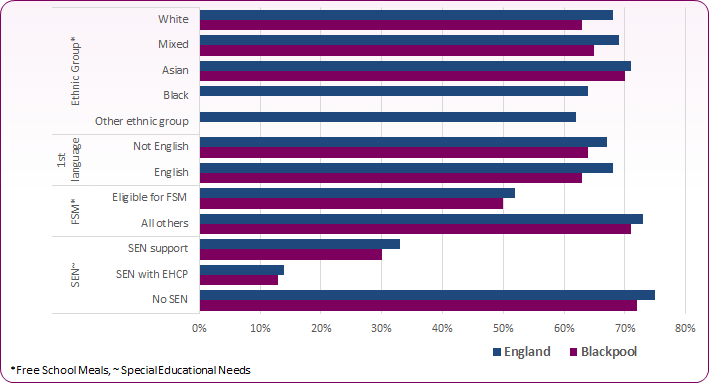
Figure 21: Percentage of pupils reaching the expected standard at KS2 in all of reading, writing and maths by characteristic of child, 2022
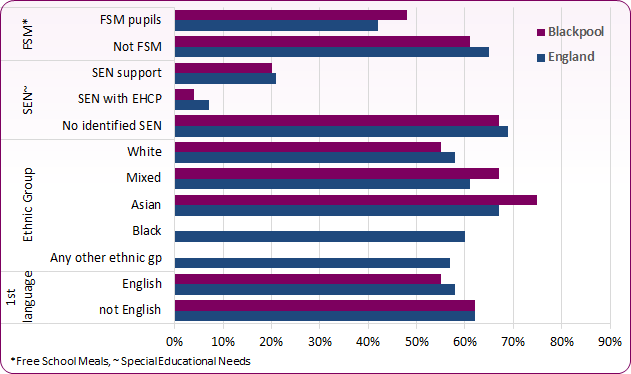 Source: DfE, National curriculum assessments at key stage 2, England 2021. Note: Blackpool proportions of Black and 'Any other group' excluded due to low eligibility numbers.
Progress is now measured by a 'value added' type measure in reading, writing and mathematics. The progress measures compare pupils’ key stage 2 results to those of other pupils nationally with similar prior attainment.
-
- A positive score means pupils in this school on average do better at KS2 than those with similar prior attainment nationally.
- A negative score means pupils in this school on average do worse at KS2 than those with similar prior attainment nationally.
A negative score does not mean that pupils did not make any progress, rather it means they made less progress than other pupils nationally with similar starting points. There is no 'target' for the amount of progress an individual pupil is expected to make.
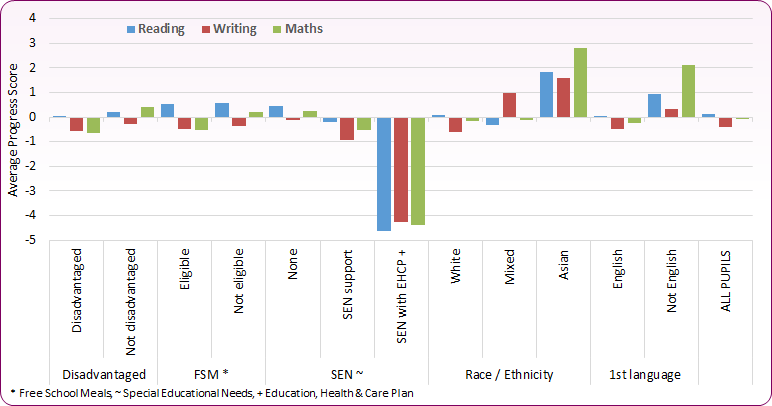
Figure 22 shows the attainment gap between pupils with specific characteristics and children who do not fall into that category. Negative values indicate lower percentages of pupils achieving the expected progress in the indicated topic. On average, pupils in most groups in Blackpool progressed better than the national level in reading, but less well in mathematics and writing. Those with Special Education Needs Education, Health and Care Plans (EHCPs) progressed less well than national counterparts across all three areas.
Progression scores across all three domains have reduced in Blackpool since the last assessed period in 2019.
Figure 22: Key Stage 2 Progress by characteristic of pupil, Blackpool, 2022
 Source: DfE, National curriculum assessments at key stage 2, England 2021/22
School Achievement: Secondary School
Achievement at secondary level is usually measured by Key Stage 4 exam results and reported against national averages. For the Covid-19 school period of 2019/20, students were awarded a school-assessed grade (based on what the school believed the student would most likely have achieved) or their calculated grade using a model developed by Ofqual - whichever of the two was higher. For 2020/21 students were only assessed on the content they had been taught, and schools were given flexibility to decide how to assess performance (e.g. mock exams, class tests and non-exam assessments). Teacher Assessed Grades (TAGs) were then determined by teachers on the range of evidence available. Reported results for the Covid period reflect these changes in assessment approach, and caution should be exercised when making comparisons. For further information see the DfE policy paper 'School and College Accountability: 2020 to 2021 academic year'.
A new secondary school accountability system was implemented in 2016. The 2016 headline accountability measures for schools are: Progress 8, Attainment 8, and English Baccalaureate (EBacc) entry and achievement.
-
- Progress 8 is based on students' progress measured across eight subjects: English; Mathematics; three other English Baccalaureate (EBacc) subjects (sciences, computer science, geography, history and languages); and three further subjects, which can be from the range of EBacc subjects, or can be any other GCSE or approved, high-value arts, academic, or vocational qualification. It aims to capture the progress pupils make from the end of key stage 2 to the end of key stage 4. A score of above 0 means a student is making above average progress.
-
- Attainment 8 is the students' average achievement across these eight subjects.
-
- The English Baccalaureate - though not a qualification in itself - is a measure of success in core academic subjects, specifically English, mathematics, history or geography, the sciences and a language. The EBacc aims to reverse the long-term drift away from students taking the likes of history, geography, French, Spanish and other modern languages.
GCSEs were also reformed between 2017 and 2020, with new and more demanding subject content, whilst remaining suitable for a wide range of abilities. A grading system of 9 (highest) to 1 (lowest) was introduced, with grades 9 to 4 replacing the previous levels of A* to C and grades 3 to 1 replacing D to G4.
Figure 23 shows Attainment 8 and Progress 8 scores for Blackpool, the North West and England between 2015/16 and 2021/22. Whilst year-on-year trends should not be compared due to changes to assessement and scoring over this period5, the Blackpool overall average Attainment 8 score is consistently significantly lower than the national average. This is also reflected in Progress 8 scores:
-
- The average Attainment 8 score for Blackpool pupils was 37.9 in 2021/22 compared to 48.8 nationally.
- The Blackpool Attainment 8 score has been the second lowest in the country (after Knowsley) over the past four academic years.
- The average Progress 8 score shows that similar pupils nationally achieve over three-quarters of a grade higher than Blackpool pupils, who are making below average progress.
- In 2021/22, 51.1% of students in Blackpool achieved grades 9 to 4 in English and Maths GCSE, compared to 68.8% nationally.
- 20.8% of Blackpool students were entered for the English Baccalaureate in 2021/22, compared to 38.8% nationally.
- Blackpool's girls make better progress than the boys, though their attainment is still lower than the national average.
Figure 23: Average Attainment 8 and Progress 8 Scores at the End of Key Stage 4, 2015/16 to 2021/22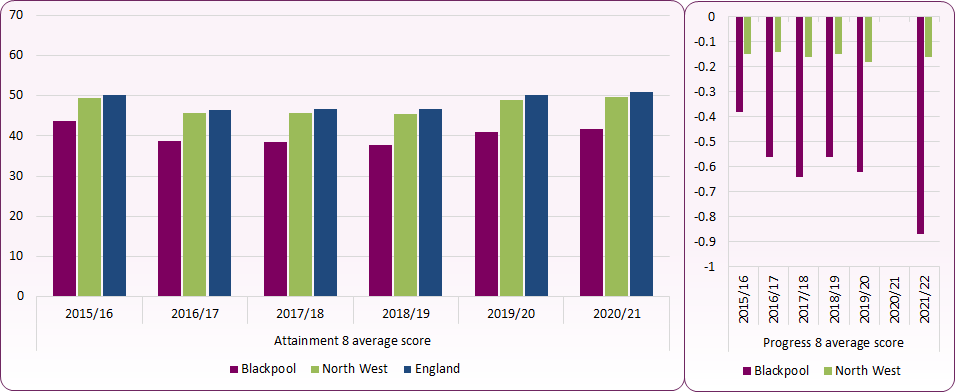 Source: Department for Education, Key Stage 4 Performance Academic Year 2015/16 to 2021/22 datasets. No progress 8 data was produced for 2020/21.
Figure 24: Pupils entered and their achievements in the components of the English Baccalaureate, 2021/22
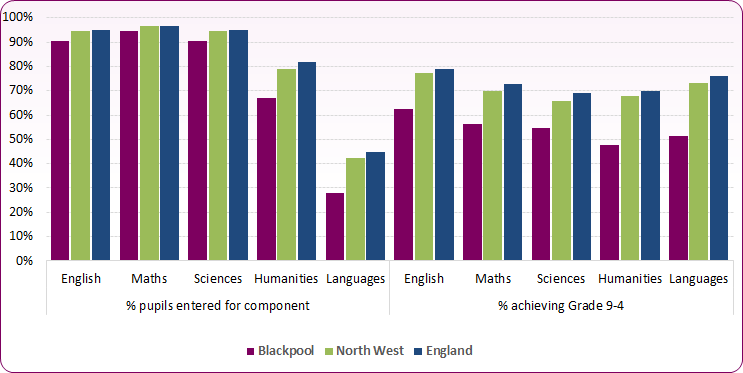 Source: Department for Education, Key Stage 4 Performance, Academic Year 2021/22
Key stage 4 achievement by pupil characteristic
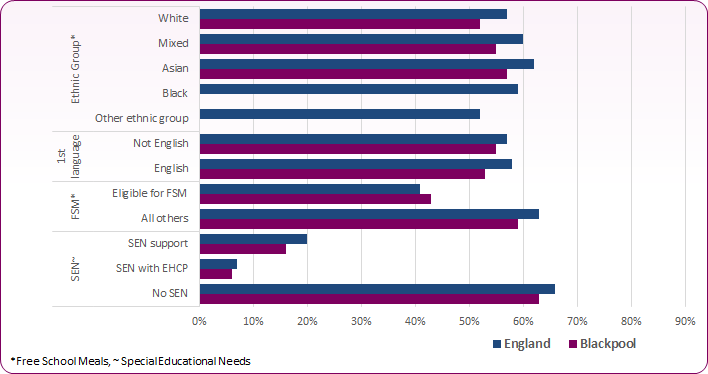
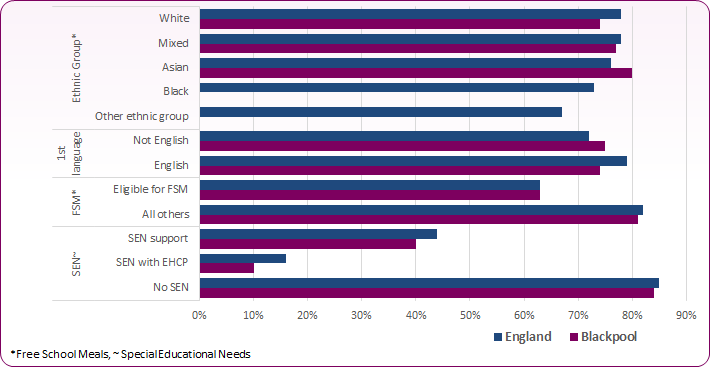
Being from low income background, having special educational needs or being eligible for free school meals appears to affect achievement negatively. On the other hand, females, Asian young people and those for whom English is an additional language perform better than average (Figure 25).
Figure 25: Average attainment 8 score per pupil by pupil characteristic in Blackpool, 2021/22
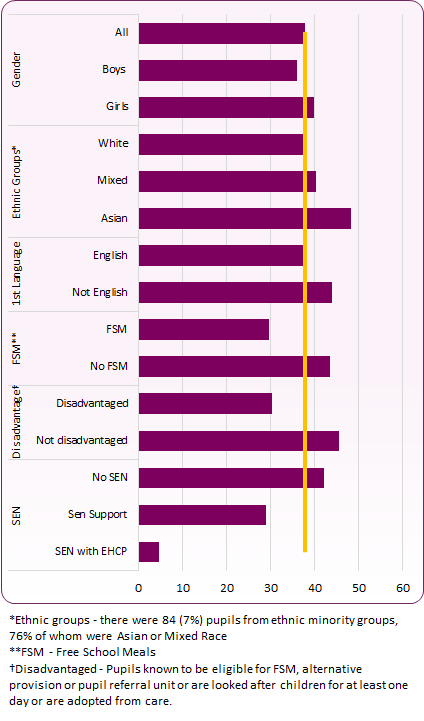 Source: Department for Education, Key Stage 4 Performance, Academic Year 2021/22
Blackpool Opportunity Area
Opportunity areas are part of the government's national plan for dealing with social mobility through education. The plan, 'Unlocking Talent, Fulfilling Potential' sets out how they will remove obstacles that could stop people from achieving their potential.
The primary purpose of Opportunity Areas is to focus local and national resources to increase social mobility. The programme will involve focusing the Department for Education's energy, ideas and resources to provide children and young people with the opportunities to fulfil their potential. It will adopt a place-based approach involving the whole education community, from early years to employment, in the areas of the country where social mobility is lowest. Blackpool is one of the 12 opportunity areas.
The local plan to deliver opportunities for children and young people is the Blackpool Opportunity Area 2017-20 delivery plan
The priorities for Blackpool are to:
- Raise attainment and progression in Blackpool's schools
- Support vulnerable children and families to improve attendance and outcomes, and to reduce exclusions from school
- Improve advice and support for young people when moving between schools/colleges and into work.
School Place Planning
In order to plan for future demand on primary and secondary school places, Blackpool Council uses a pupil projection model based on:
-
- Numbers on roll data provided by the January School Census
- ONS Single Age Population Estimates
- ONS Birth Projections
- Blackpool Council Housing Monitoring Report
Estimates also take into account anticipated new housing builds in the area. To provide more detailed insight, Blackpool is divided into three planning areas: North, Central and South. The different parts of Blackpool are facing different issues about school places and although the total area of the borough is small:
-
- There are logistical problems in crossing the town by public transport
- Traffic levels are very high making pedestrian access hazardous for children
- Housing type and density varies across the town
The model shows that Blackpool has sufficient primary and secondary place provision for anticipated demand up to 2032 (Figures 26 and 27). Demand for secondary school places is likely to peak in 2026/27, though there is still predicted to be a surplus in places across the three Blackpool areas. The greatest pressure on capacity is likely to be in North and Central areas.
Figure 26 - Surplus Capacity in Primary Schools by Area 2019-2032
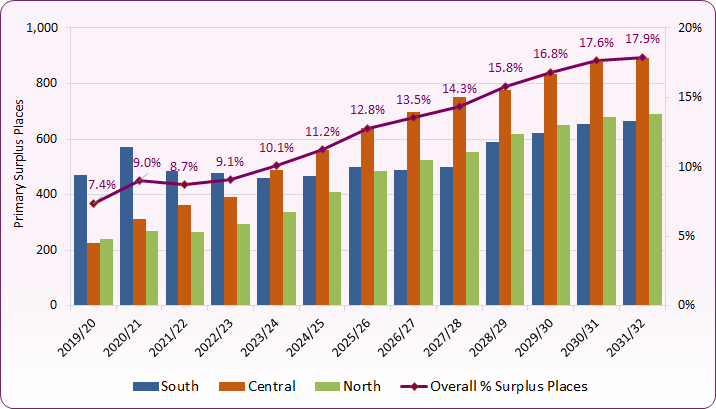 Source: Blackpool Council Pupil Projection Model (School Capacity Return 2021)
Figure 27 - Surplus Capacity in Secondary Schools by Area 2019-2032
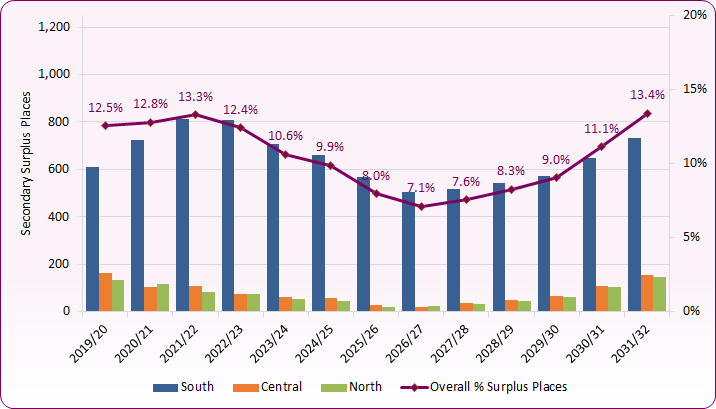 Source: Blackpool Council Pupil Projection Model (School Capacity Return 2021)
School place demand is sensitive to the availability of places in Lancashire schools that border Blackpool. Historically a significant proportion of Blackpool children move from Blackpool primary education to Lancashire County secondary schools.
Figure 28 shows the proportion of Blackpool children who are offered a school place outside of the area at the start Year 0 (primary school reception year) and Year 7 (secondary school). Recent trends indicate a rise in the number and proportion of children offered primary school places outside Blackpool, though this has reduced slightly for the most recent 2022/23 intake. The proportion of those with secondary school offers outside the Blackpool area remains higher than primary school levels, though the numbers and overall proportion has declined from 17.5% in 2017/18 to 14% in 2022/23.
Figure 28: Year 6 and Year 7 pupils living in Blackpool who attend schools maintained by other local authorities
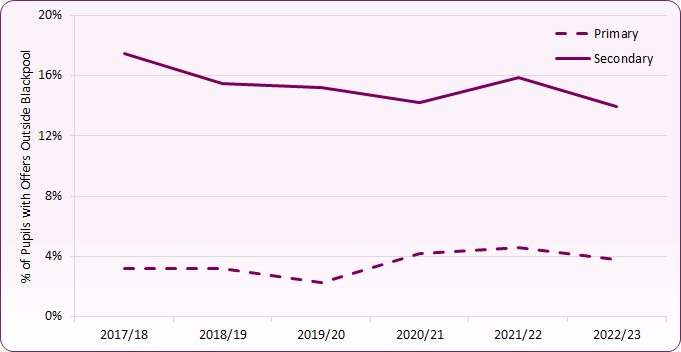 Source: Blackpool Council School Preference Data, 2022
Beyond School: Post-16 Employment, Education and Training
The UK Government's Education and Skills Act 2008 introduced legislation intended to 'raise the participation age' (RPA), and from 2013/14 young people leaving school have been required to continue in learning or training until the age of 18. They can choose:
- full-time education, such as school, college or home education
- apprenticeships, work-based learning
- part-time education or training if they are employed, self-employed or volunteering for at least 20 hours a week
The main focus on those not in education, employment or training (NEET) is young people aged between 16 and 18 years, with 16-17 year olds required to remain in education and training, and 18 year olds in the first year of post-compulsory education.
Young people not in employment, education or training (NEET) are some of the most vulnerable as their chances for entering the labour market diminishes the longer they are inactive. Post-16 participation in education and wider learning can lead to increased attainment and employment, as well as having wider social and health benefits6.
The Department for Education (DfE) publishes annual estimates of 16 and 17 year olds' participation in education and training. These estimates are based on figures collected in March each year, with NEET and rates of 'not knowns' based on an average of data from December to February. This is presented in annual NEET and Participation LA Scorecard.
DfE data for 2021/22 suggests that:
- 86.7% of 16 and 17 year olds were participating in education and training in March 2022, down from 88% in March 2021.
- This is significantly lower than the England level of 92.9% and North West of 92.2%.
- 75.8% were in full-time education, 5.5% in apprenticeships and 5.5% in 'other' forms of education and training.
- 6.6% of 16 and 17 year olds were NEET, or their status was not know, between December 2021 and February 2022, significantly higher than England (4.7%) and North West (4.9%) levels
- 4.6% were NEET, significantly higher than England (2.6%) and the North West (2.6%), and up 0.2 percentage points since 2020
- The status of 2% of 16 and 17 year olds was unknown. This is similar to England (2.2%) and the North West (1.8%), but represents a 2.5 percentage point reduction from 2020.
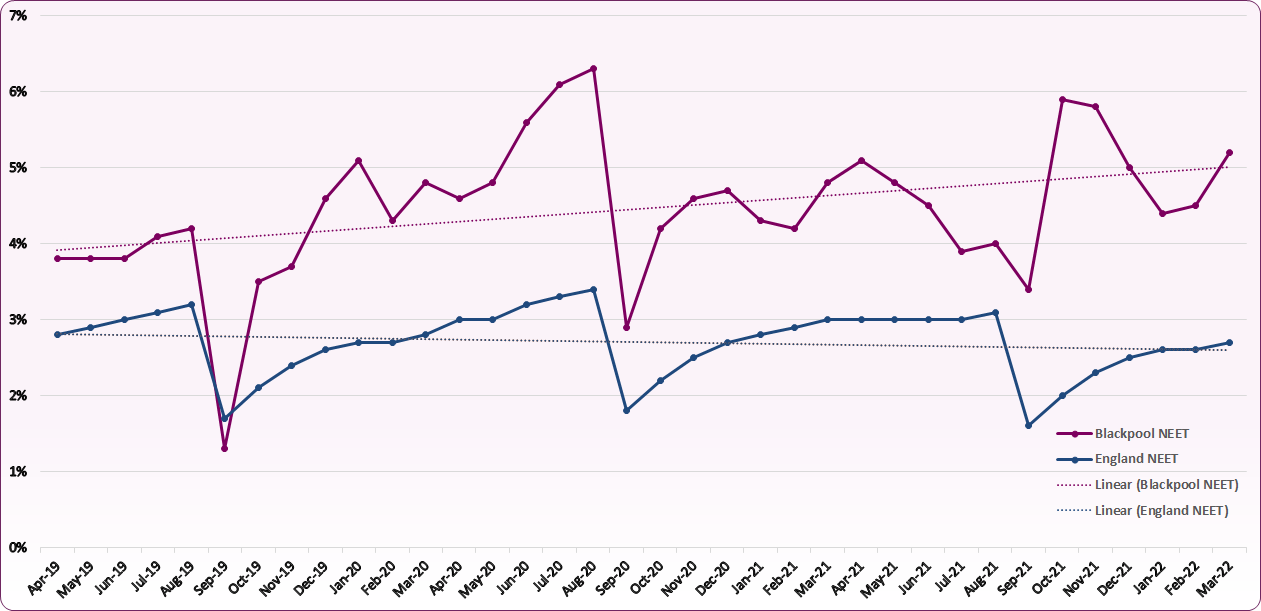
Figures from Blackpool Council shows how the proportion of young people not in education, employment or training over the year varies in Blackpool, with in-year peaks and troughs often being more pronounced than national averages (Figure 29). Recent figures are also affected by the impact of the COVID-19 pandemic and lockdown periods on education providers, the labour market, and young people themselves. Overall, the proportion of young people who are NEETs throughout the year is trending slightly upwards in Blackpool, and continues to be significantly higher than the national average, which has been gradually declining.
Figure 29: Percentage of young people Not in Education, Employment or Training (NEET), Blackpool and England 2019-2022
 Source: Blackpool Council
Reasons for becoming NEET vary, but vulnerable groups such as looked after children / care leavers, carers, teenage parents, those with mental health concerns, and young offenders have a greater likelihood of being NEET. DfE data shows that, as of the end of 2021, 50% of young people in Blackpool who were NEET or whose status was not known were considered to be vulnerable7. This is more than double the proportion in England (23.6%) and the North West (24.8%).
Those with special educational needs (SEN) also have a higher likelihood of being NEET:
- 11.8% of those who received SEN support were NEET, or had an unknown status, in Blackpool at the end of 2021 (8.4% in England)
- 6.8% of those with SEND Education, Health and Care Plans (EHCPs) were NEET, or had an unknown status, in Blackpool at the end of 2021 (8.6% in England)
- 6.2% of those with no special educational needs support were NEET, or had an unknown status, in Blackpool at the end of 2021 (4.2% in England)
Local strategies and actions
Blackpool Council provides school improvement officers to help each of our schools reach and maintain high performance.
The Blackpool Opportunity Area 2017-20 delivery plan shows the priorities for dealing with social mobility through education.
[] see Office for Health Improvement and Disparities, Child and Maternal Health Data. Comparisons based on key stage 2 pupils meeting expected standard for reading, writing and maths, and average Attainment 8 scores (original source: Department for Education).
[] Department for Education, Children looked after in England, including adoption: 2020 to 2021
[] Department for Education, Permanent exclusions and suspensions in England: 2019 to 2020 and 2020 to 2021
[] Ofqual (2019) GCSE 9 to 1 grades: a brief guide for parents.
[] From 2018, Attainment 8 had a maximum point score of 90, compared to a maximum of 87 in 2017 and 80 in 2016. This helped to minimise fluctuations in the average Attainment 8 scores following the phased introduction of 9-1 reformed GCSEs. These differences should be considered when comparing Attainment 8 scores between 2016-2019. In 2020 and 2021, the majority of Attainment 8 scores were based on qualifications that were awarded via centre assessment grades rather than exams, so they are likely to be higher due to this and are not comparable to previous years.
[] Department for Health (2014) 'Evidence check' memorandum: Raising the participation age.
[] A young person is said to be vulnerable if they have any of the following characteristics: looked after/in care; refugee/asylum seeker; carer (not own child); disclosed substance misuse; care leaver; supervised by Youth Offending Team; parent (not caring for own child); in alternative provision; mental health flag.